

Breakout and Potential Breakout Stocks of the #PHARMA Sector.📊
A thread on Pharma Sector Stocks🧵🧵
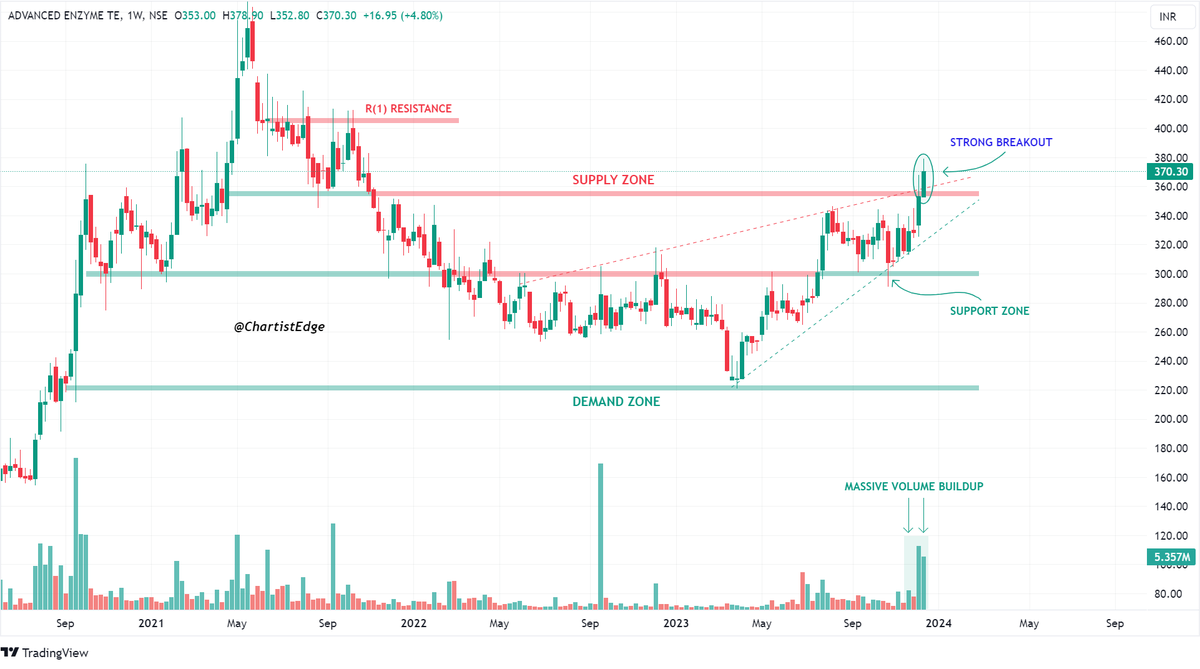
1. ADVENZYMES (WTF)
•Strong breakout chart
•Ascending triangle type pattern
•Long-range consolidation
•Massive volume buildup near the breakout zone
A thread on Pharma Sector Stocks🧵🧵
1. ADVENZYMES (WTF)
•Strong breakout chart
•Ascending triangle type pattern
•Long-range consolidation
•Massive volume buildup near the breakout zone
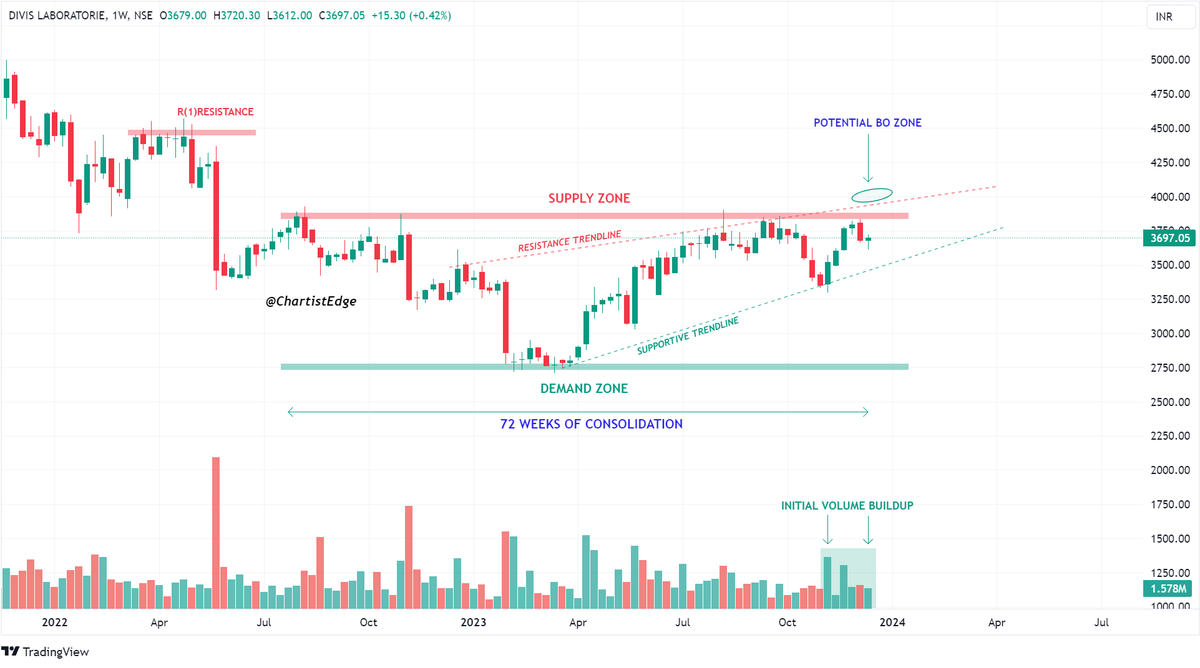
2. DIVISLAB (WTF)
•Potential breakout chart
•Ascending triangle pattern
•Long-range consolidation
•Initial volume buildup near the breakout zone and may rise post-breakout
•R(1) can act as a good resistance level after the price breaks out of the consolidation zone
•Potential breakout chart
•Ascending triangle pattern
•Long-range consolidation
•Initial volume buildup near the breakout zone and may rise post-breakout
•R(1) can act as a good resistance level after the price breaks out of the consolidation zone
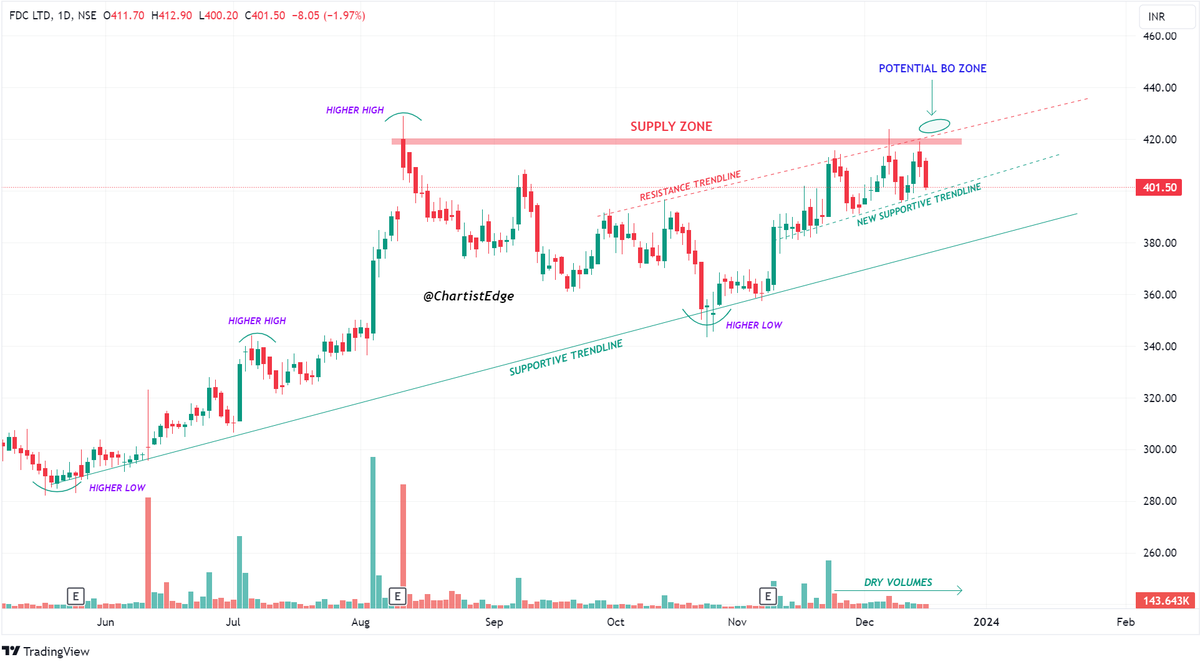
3. FDC (DTF)
•Potential breakout chart
•Ascending triangle pattern
•Trading in HH-HL formation
•The volumes are currently flat/dry but it should rise after the price gives a strong breakout above the supply zone
•Potential breakout chart
•Ascending triangle pattern
•Trading in HH-HL formation
•The volumes are currently flat/dry but it should rise after the price gives a strong breakout above the supply zone
4. GRANULES (WTF)
•Potential breakout chart
•Symmetrical triangle pattern
•Long-range consolidation
•Massive volume buildup near the breakout zone
•Potential breakout chart
•Symmetrical triangle pattern
•Long-range consolidation
•Massive volume buildup near the breakout zone

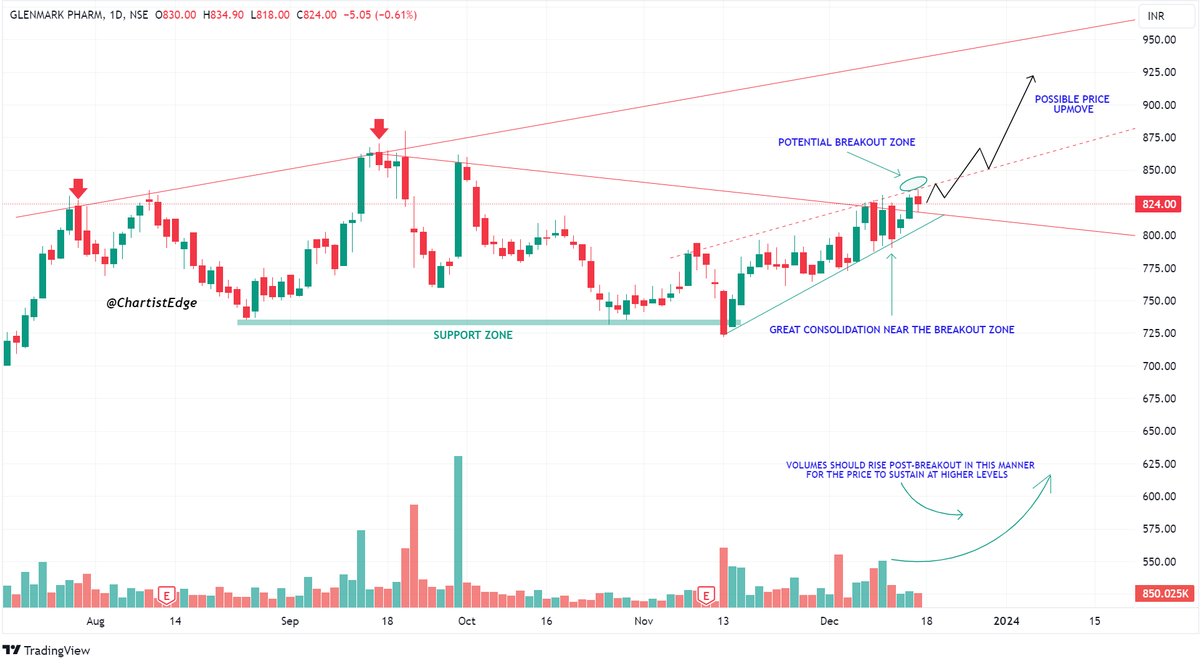
5. GLENMARK (DTF)
•Potential breakout chart
•Symmetrical triangle pattern
•Great consolidation near the breakout zone which indicates that the price is gearing up for a move.
•The volumes are currently flat but should rise if the price gives a strong breakout
•Potential breakout chart
•Symmetrical triangle pattern
•Great consolidation near the breakout zone which indicates that the price is gearing up for a move.
•The volumes are currently flat but should rise if the price gives a strong breakout
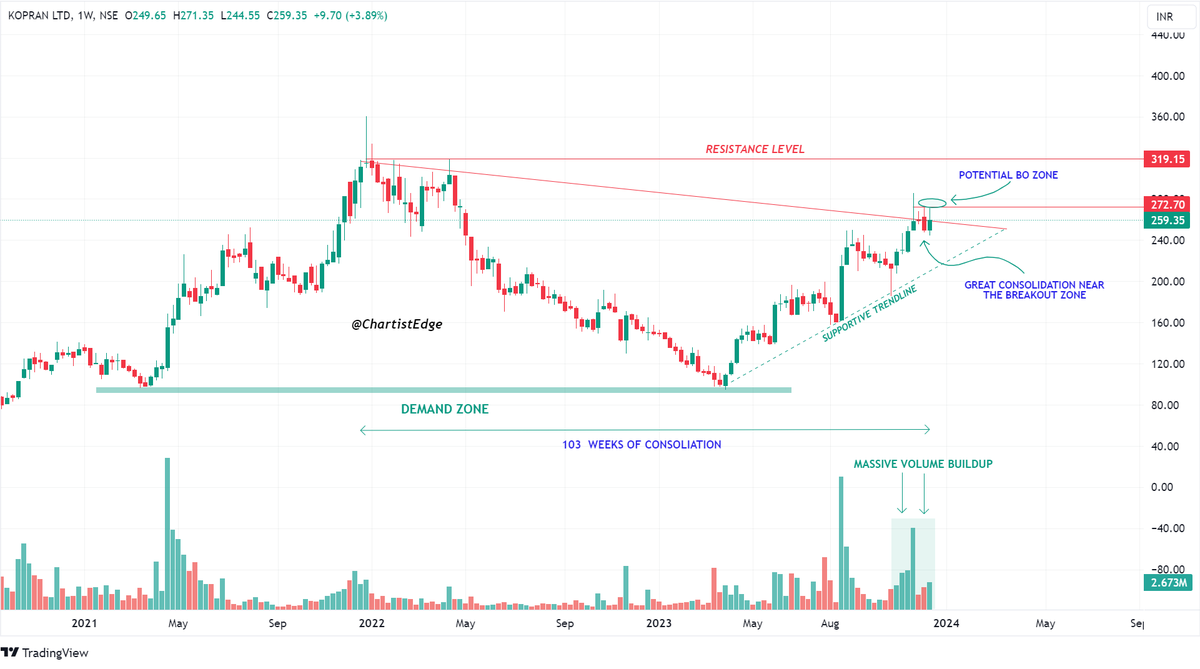
6. KOPRAN (WTF)
•Potential breakout chart
•Symmetrical triangle pattern
•Currently trading in HH-HL formation
•Great consolidation near the breakout zone which indicates that the price is gearing up for a move
•Massive volume buildup near the breakout zone
•Potential breakout chart
•Symmetrical triangle pattern
•Currently trading in HH-HL formation
•Great consolidation near the breakout zone which indicates that the price is gearing up for a move
•Massive volume buildup near the breakout zone
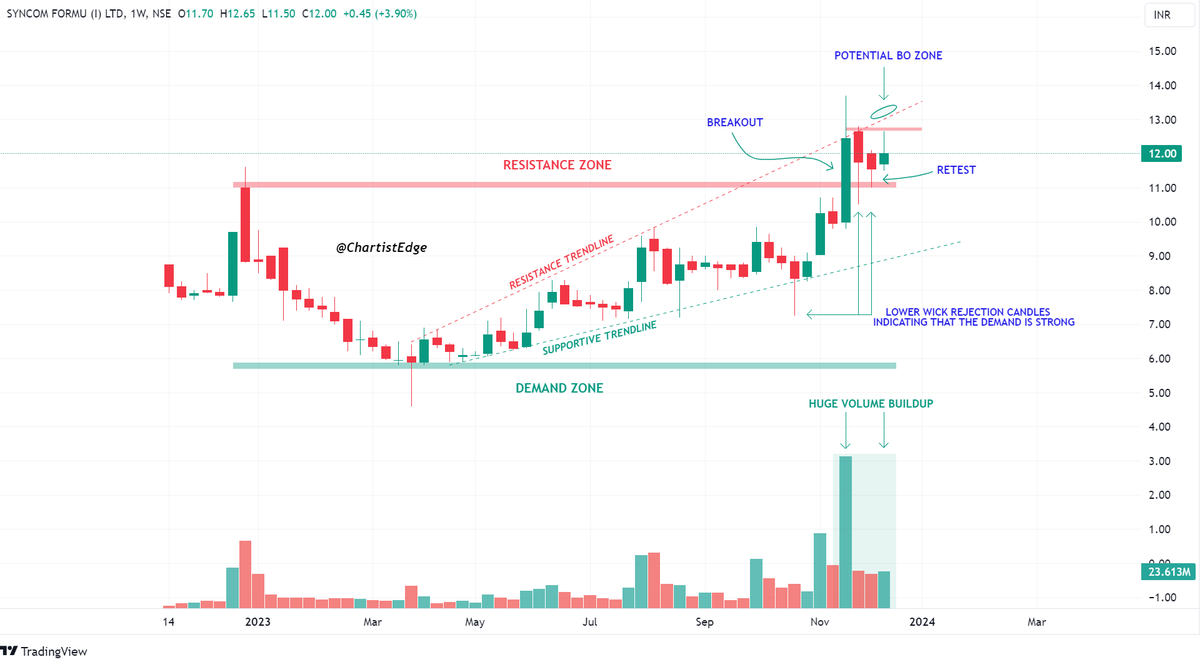
7. SYNCOMF (WTF)
•Potential breakout chart
•The price is currently trying to retest its breakout levels
•If the price successfully retests & sustains above the breakout levels then we can expect a good upside momentum
•Huge volume buildup near the breakout zone
•Potential breakout chart
•The price is currently trying to retest its breakout levels
•If the price successfully retests & sustains above the breakout levels then we can expect a good upside momentum
•Huge volume buildup near the breakout zone
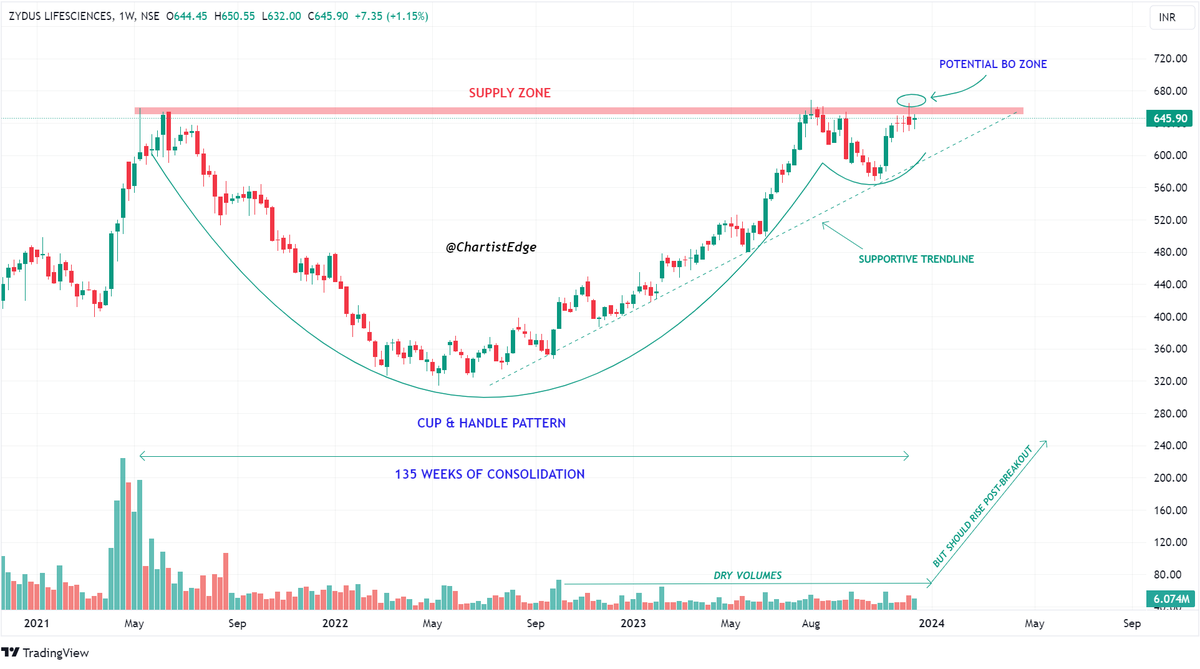
8. ZYDUSLIFE (WTF)
•Potential breakout chart
•Cup & handle pattern
•Long-range consolidation(135 weeks)
•The volumes are currently dry but it should rise if the price gives a strong breakout above the supply zone levels
•Potential breakout chart
•Cup & handle pattern
•Long-range consolidation(135 weeks)
•The volumes are currently dry but it should rise if the price gives a strong breakout above the supply zone levels
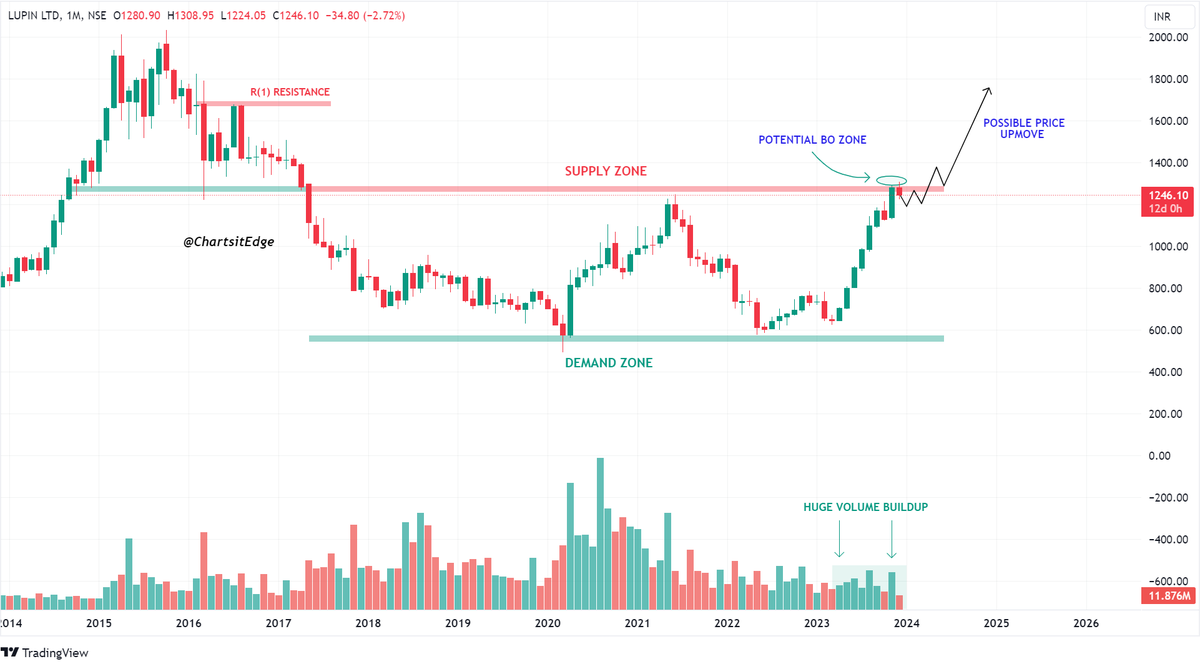
9. LUPIN (MTF)
•Potential breakout chart
•Darvas box pattern
•Long-range consolidation
•Huge volume buildup near the breakout zone
•R(1) can act as a good resistance level if the price gives a strong breakout above the supply zone levels
•Potential breakout chart
•Darvas box pattern
•Long-range consolidation
•Huge volume buildup near the breakout zone
•R(1) can act as a good resistance level if the price gives a strong breakout above the supply zone levels
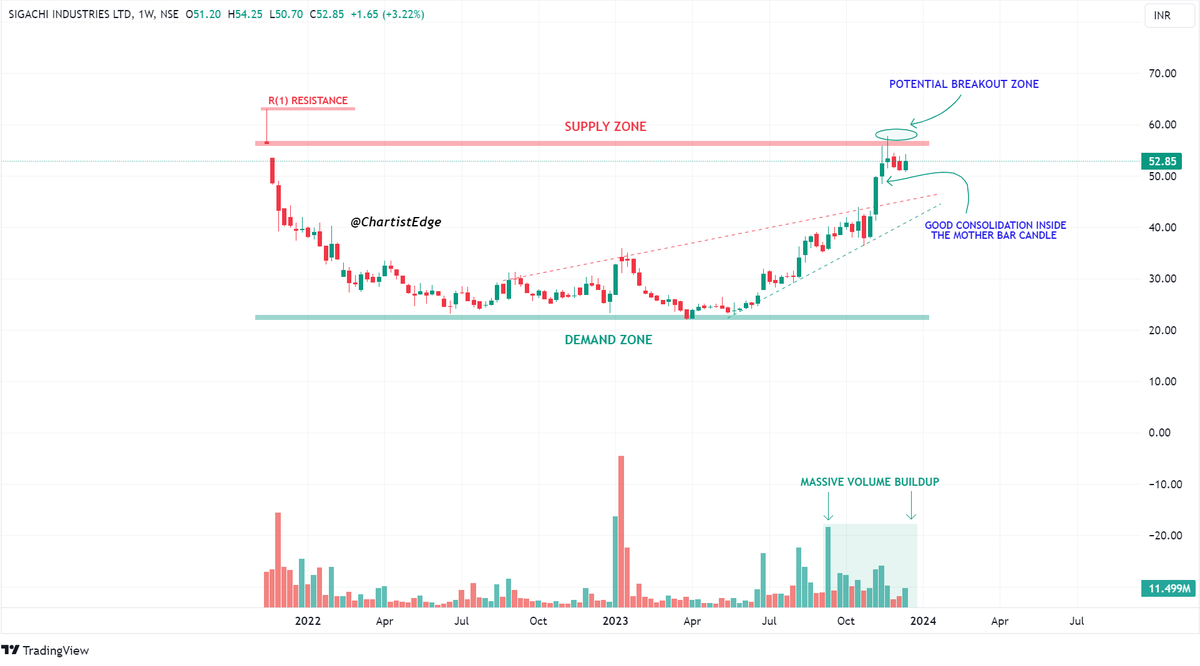
10. SIGACHI (WTF)
•Potential breakout chart
•Rounding bottom pattern
•Long-range consolidation
•Massive volume buildup near the breakout zone
•R(1) can act as a good resistance level if the price gives a strong breakout above the supply zone levels.
•Potential breakout chart
•Rounding bottom pattern
•Long-range consolidation
•Massive volume buildup near the breakout zone
•R(1) can act as a good resistance level if the price gives a strong breakout above the supply zone levels.
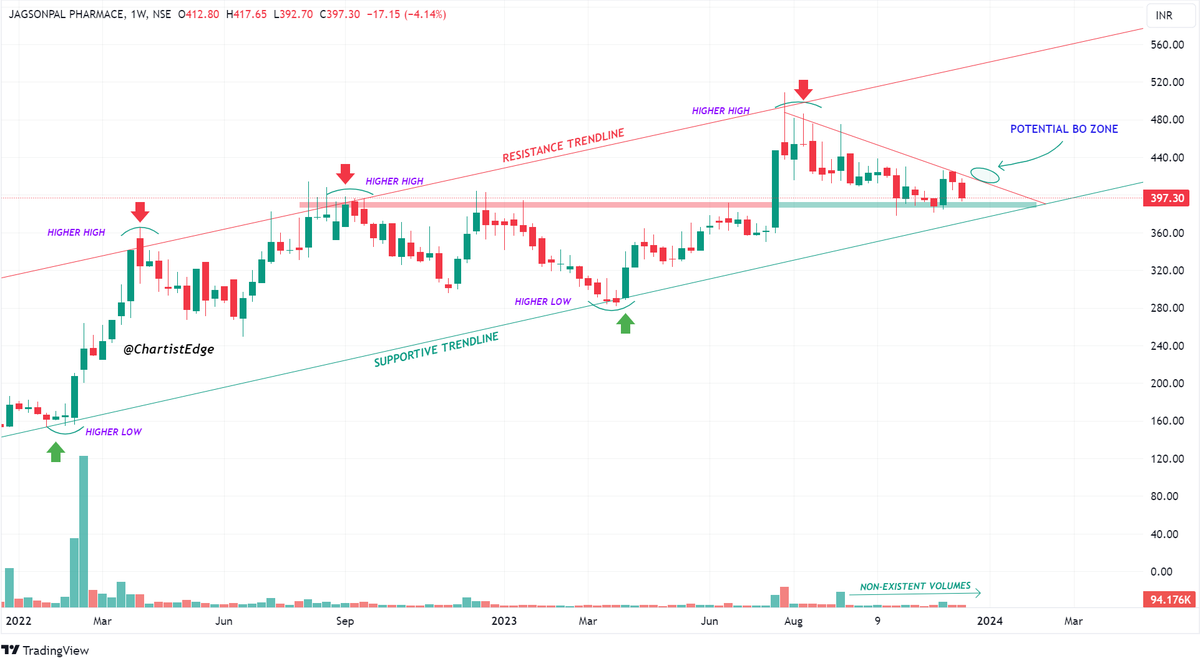
11. JAGSNPHARM (WTF)
•Potential breakout chart
•The price is currently traveling in a parallel channel with HH-HL formation
•The volumes are currently dry but it should rise after the price gives a strong breakout
•Potential breakout chart
•The price is currently traveling in a parallel channel with HH-HL formation
•The volumes are currently dry but it should rise after the price gives a strong breakout
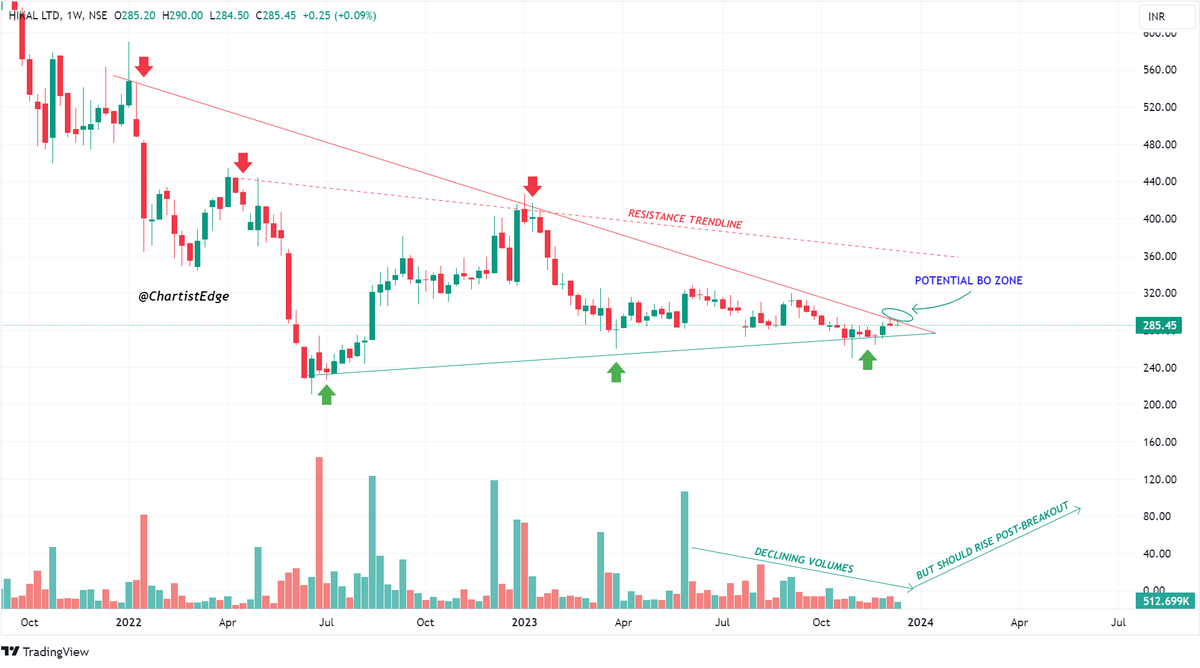
12. HIKAL (WTF)
•Potential breakout chart
•Descending triangle type pattern
•Long-range consolidation
•The volumes are currently flat but it should rise after the price gives a strong breakout
•Potential breakout chart
•Descending triangle type pattern
•Long-range consolidation
•The volumes are currently flat but it should rise after the price gives a strong breakout
Loading suggestions...