

A Detailed Thread on 8 Case Studies(Technical Analysis)📊🧵🧵
Bookmark this so that you don't have to look anywhere else🤝🔥
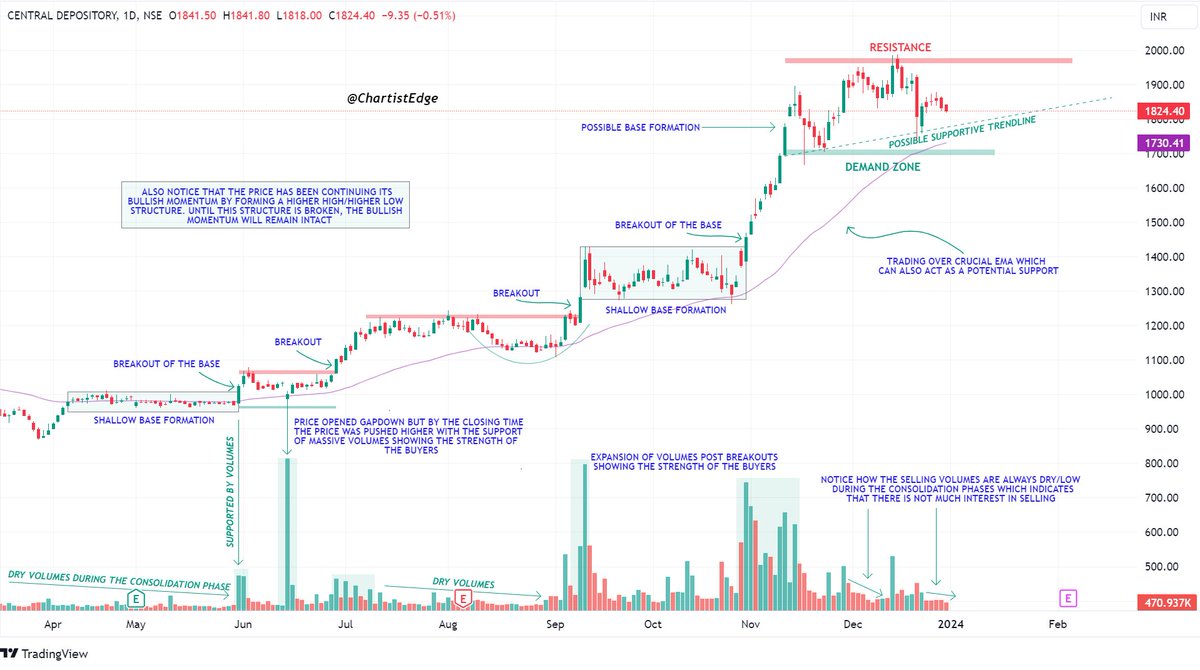
1. CDSL (DTF)
•Potential breakout chart
•Long-term bullish structure.
•Trading over key EMA
•Currently in the accumulation phase with HL structure
Bookmark this so that you don't have to look anywhere else🤝🔥
1. CDSL (DTF)
•Potential breakout chart
•Long-term bullish structure.
•Trading over key EMA
•Currently in the accumulation phase with HL structure
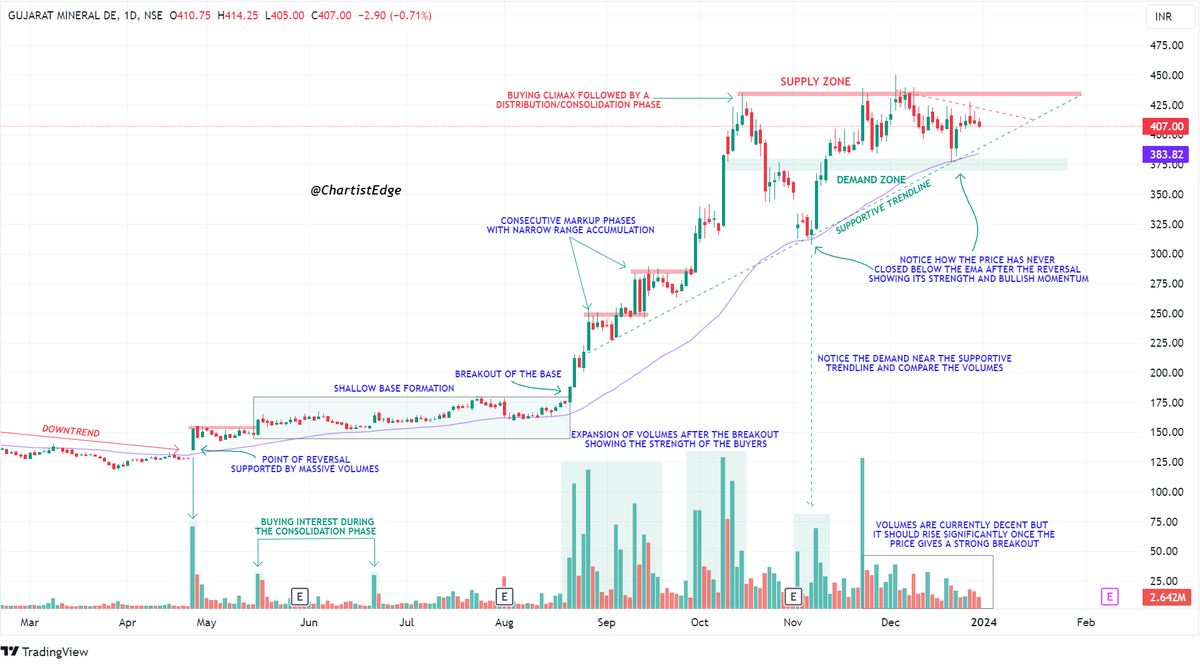
2. GMDC (DTF)
•Potential breakout chart
•Long-term bullish structure with higher high/higher low formation
•Trading over key EMA+long term supportive trendline
•The price is currently in the accumulation phase with higher low formation and is also trading in a narrow range
•Potential breakout chart
•Long-term bullish structure with higher high/higher low formation
•Trading over key EMA+long term supportive trendline
•The price is currently in the accumulation phase with higher low formation and is also trading in a narrow range
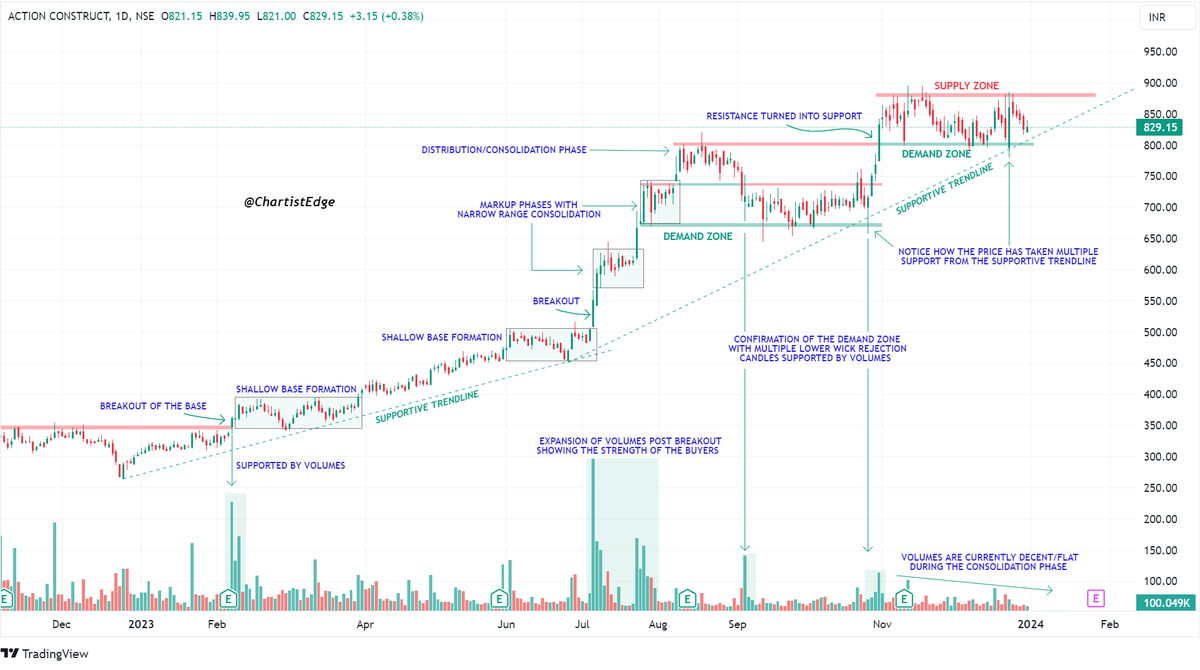
3. ACE (DTF)
•Potential breakout chart
•Long-term strong bullish structure with higher high/higher low formation
•In the current accumulation phase, the price is trading in a tight range and may give a decent move if the structure is broken(upside or downside)
•Potential breakout chart
•Long-term strong bullish structure with higher high/higher low formation
•In the current accumulation phase, the price is trading in a tight range and may give a decent move if the structure is broken(upside or downside)
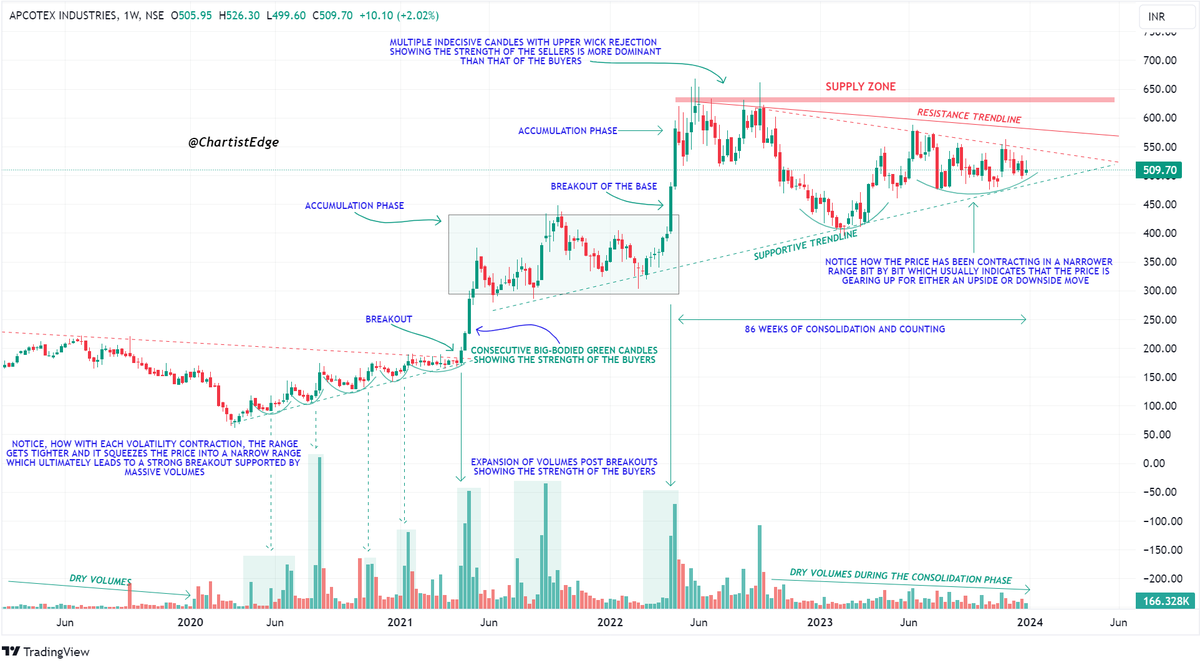
4. APCOTEX (WTF)
•Potential breakout chart
•Long base formation with volatility contraction. Also, the price has been squeezed into a tight range as seen in the chart
•Overall the price has been trading in a HH-HL formation
•Potential breakout chart
•Long base formation with volatility contraction. Also, the price has been squeezed into a tight range as seen in the chart
•Overall the price has been trading in a HH-HL formation
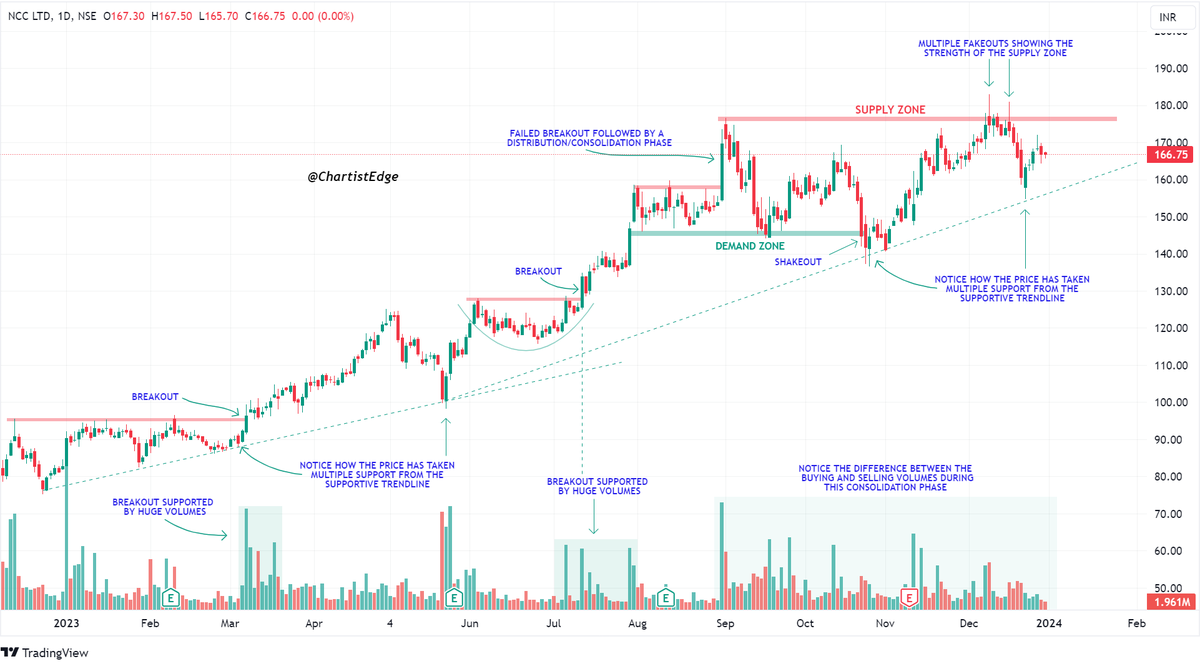
5. NCC (DTF)
•Potential breakout chart
•Long base formation
•Overall trading in a HH-HL formation
•The price has been consolidating inside the base with a higher low formation which is a bullish sign for the price
•Potential breakout chart
•Long base formation
•Overall trading in a HH-HL formation
•The price has been consolidating inside the base with a higher low formation which is a bullish sign for the price
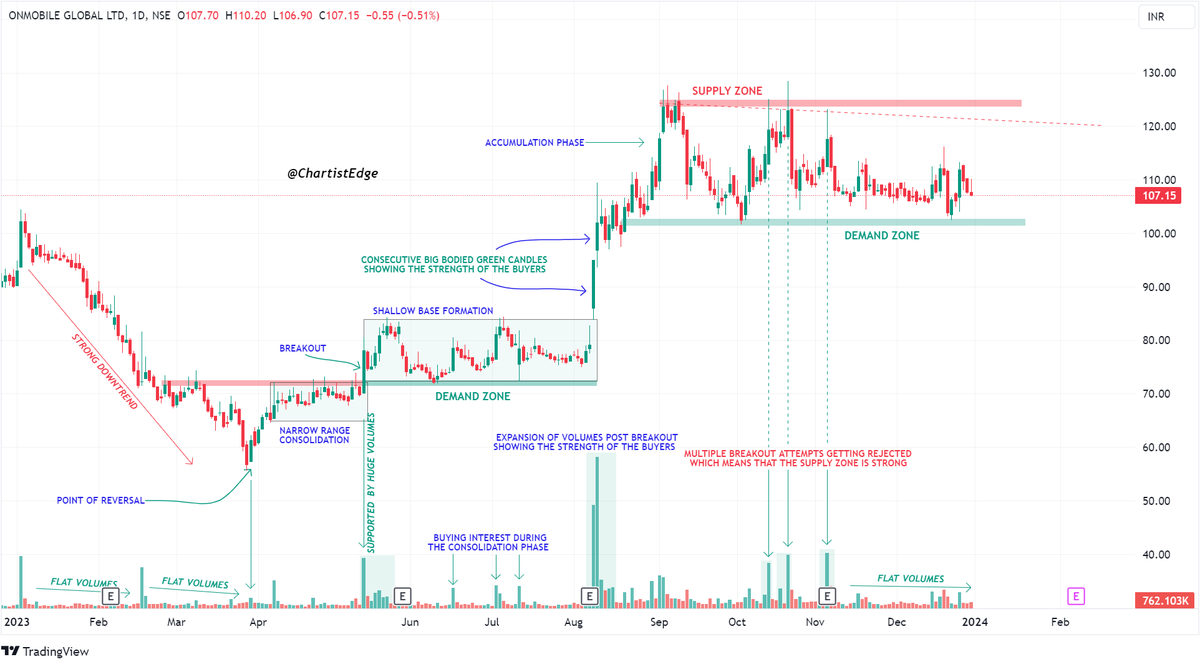
6. ONMOBILE (WTF)
•Long-term base formation
•Overall trading in a HH-HL formation
•The price is currently hovering near the demand zone and if the price takes support from the demand zone then we might see a good upmove in the future
•Long-term base formation
•Overall trading in a HH-HL formation
•The price is currently hovering near the demand zone and if the price takes support from the demand zone then we might see a good upmove in the future
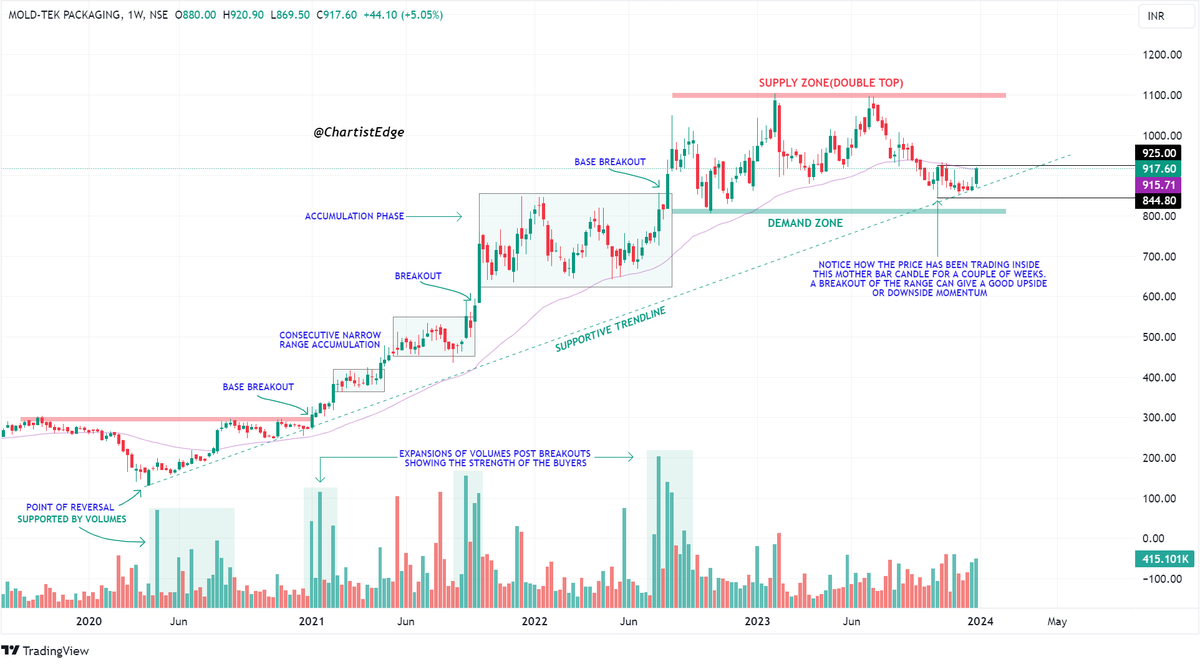
7. MOLDTKPAC (WTF)
•Potential breakout chart
•Long-term base formation
•Overall trading in a HH-HL formation
•The price has been hovering near the supportive trendline. If the price takes support from it, then we can expect a good upmove
•Potential breakout chart
•Long-term base formation
•Overall trading in a HH-HL formation
•The price has been hovering near the supportive trendline. If the price takes support from it, then we can expect a good upmove
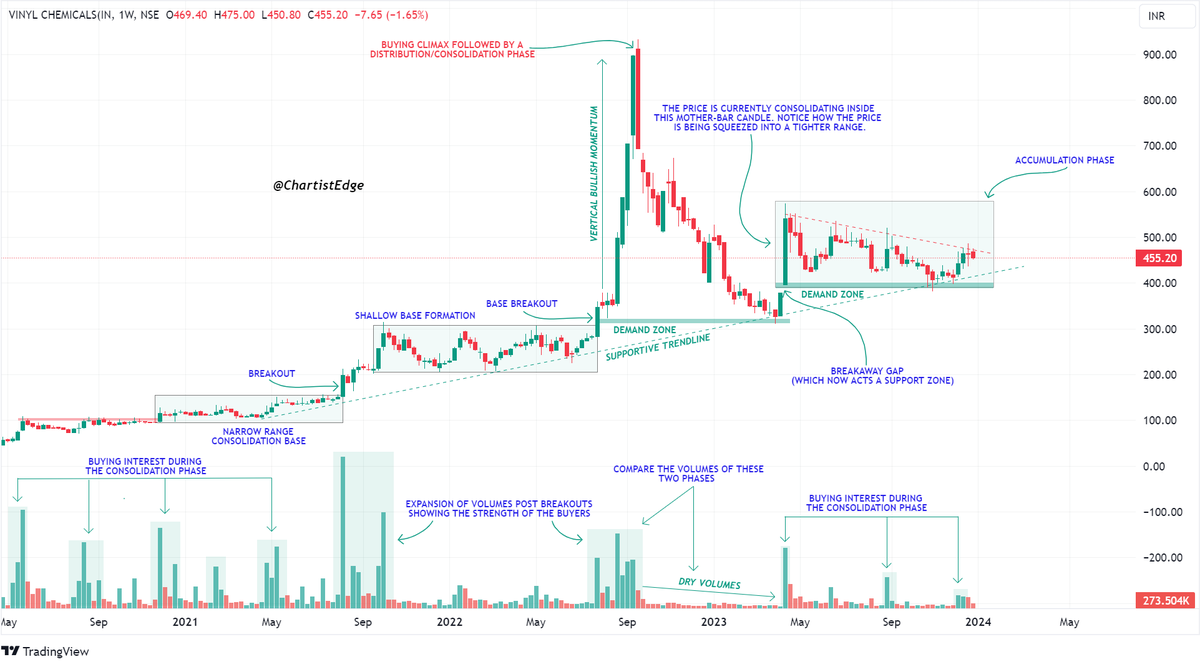
8. VINYLINDIA (WTF)
•Potential breakout chart
•The price after a vertical upside move went into a buying climax and is currently in a consolidation phase
•The price has been trading in a narrow space as seen in the chart
•Good buying interest in the consolidation phase
•Potential breakout chart
•The price after a vertical upside move went into a buying climax and is currently in a consolidation phase
•The price has been trading in a narrow space as seen in the chart
•Good buying interest in the consolidation phase
Loading suggestions...