

$DXY First Top Down Analysis of 2024 ! 💎
In a Thread 🧵
In a Thread 🧵

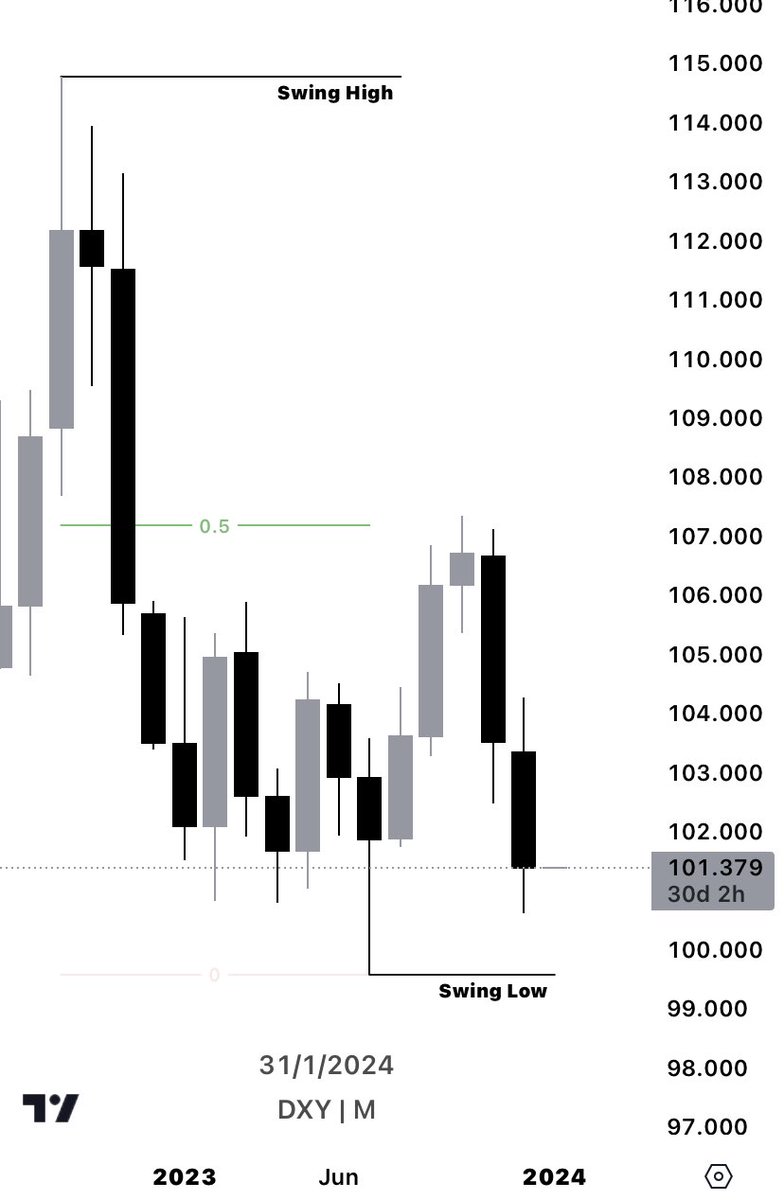
Starting with the Monthly Timeframe
We can see from Swing High to Swing Low
We have already tapped into the 50% level of this swing
Our current Monthly DOL is this Swing Low
•DOL = Draw on Liquidity
We can see from Swing High to Swing Low
We have already tapped into the 50% level of this swing
Our current Monthly DOL is this Swing Low
•DOL = Draw on Liquidity
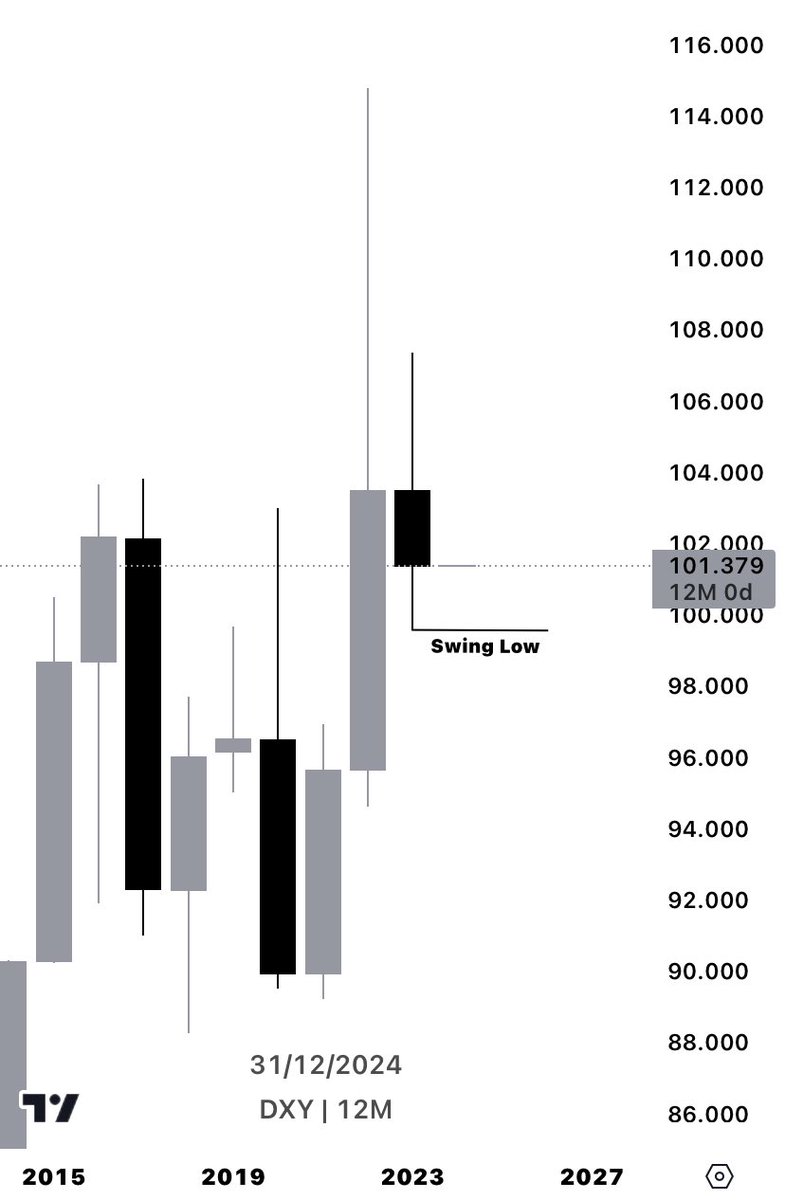
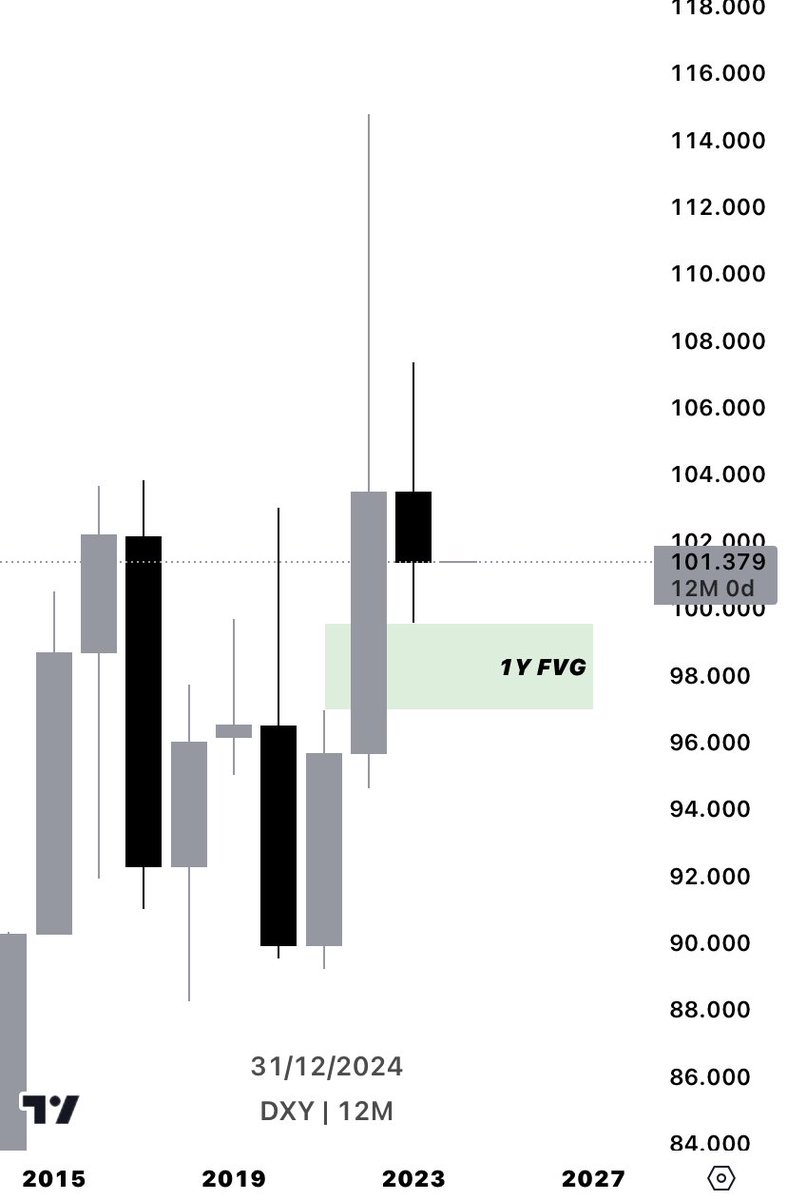
And if we take a look at the Yearly timeframe
We can see our Monthly DOL also lines up with a Yearly FVG
This makes sense going into the new year :)
Let’s move back to the Monthly to see what else we see.
We can see our Monthly DOL also lines up with a Yearly FVG
This makes sense going into the new year :)
Let’s move back to the Monthly to see what else we see.
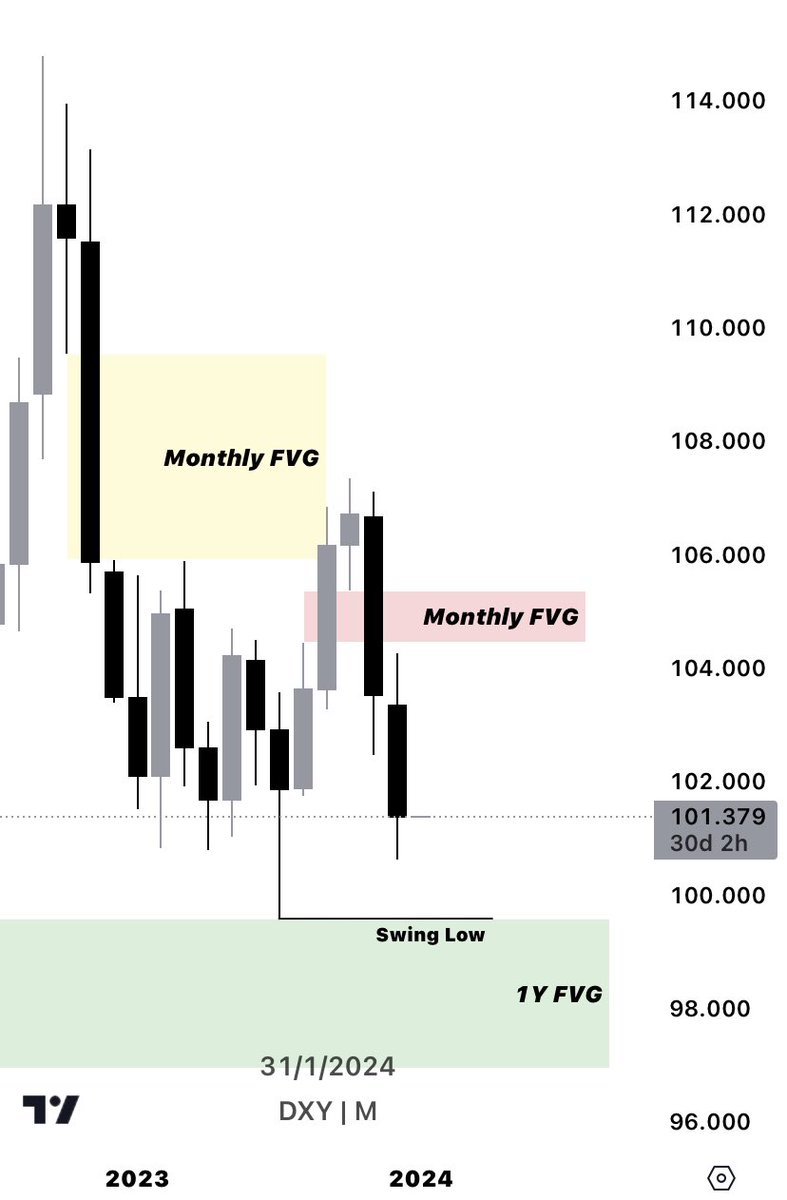
We also respected this yellow Monthly FVG
And then closed under the Red Monthly FVG
These are all signs of us being bearish as of right now on $DXY
This all makes sense for us to be attacking this current Swing Low
That’s why it’s my Monthly DOL
•DOL = Draw on Liquidity
And then closed under the Red Monthly FVG
These are all signs of us being bearish as of right now on $DXY
This all makes sense for us to be attacking this current Swing Low
That’s why it’s my Monthly DOL
•DOL = Draw on Liquidity
Let’s move onto the weekly timeframe
What do we see ?
What do we see ?

We see we are respecting Weekly PD arrays
And also violating old Weekly PD arrays, showing major strength to the downside
Old Fair Value Gaps are being violated, and New FVG’s are being respected.
I see no reason to be bullish yet…
So I am short term bullish still :)
And also violating old Weekly PD arrays, showing major strength to the downside
Old Fair Value Gaps are being violated, and New FVG’s are being respected.
I see no reason to be bullish yet…
So I am short term bullish still :)

As of right now, we are respecting this Weekly FVG
There is a chance we use this Weekly FVG, to get to the new Weekly FVG, before continuing lower
Or we could tap into a Daily PD array, and move lower.
And always remember
DO NOT MARRY THE BIAS 🫡 This is just my bias…
There is a chance we use this Weekly FVG, to get to the new Weekly FVG, before continuing lower
Or we could tap into a Daily PD array, and move lower.
And always remember
DO NOT MARRY THE BIAS 🫡 This is just my bias…


These are just my expectations going into 2024 :)
I hope you enjoyed
If you would like, I have a telegram where I post all my personal trade ideas and more post like this one ^
If you’re interested, check my pinned post, then DM me :)
I hope you enjoyed
If you would like, I have a telegram where I post all my personal trade ideas and more post like this one ^
If you’re interested, check my pinned post, then DM me :)
Loading suggestions...