

A detailed thread on Support and Resistance Patterns you NEED to know 🧵
Support and Resistance patterns are so Important!
Once I got familiar with these 10 Patterns they changed my trading career 👇
Support and Resistance patterns are so Important!
Once I got familiar with these 10 Patterns they changed my trading career 👇
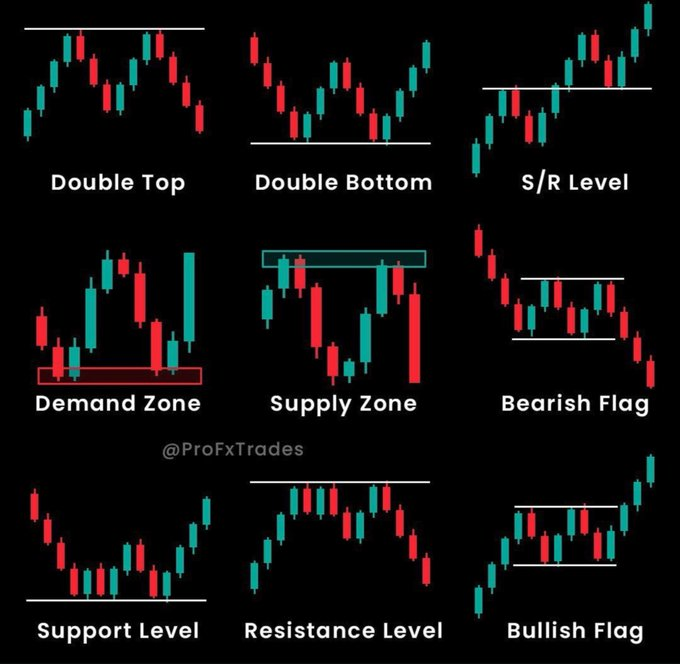
Before I start, here are some of the patterns I will be going over👇
1.Double Top
2.Double Bottom
3.S/R Level
4.Demand Zone
5. Supply Zone
6.Bearish Flag
7. Support Level
8.Resistance Level
9.Bullish Flag
10.Higher Lows
Make sure you follow me if you enjoy
1.Double Top
2.Double Bottom
3.S/R Level
4.Demand Zone
5. Supply Zone
6.Bearish Flag
7. Support Level
8.Resistance Level
9.Bullish Flag
10.Higher Lows
Make sure you follow me if you enjoy
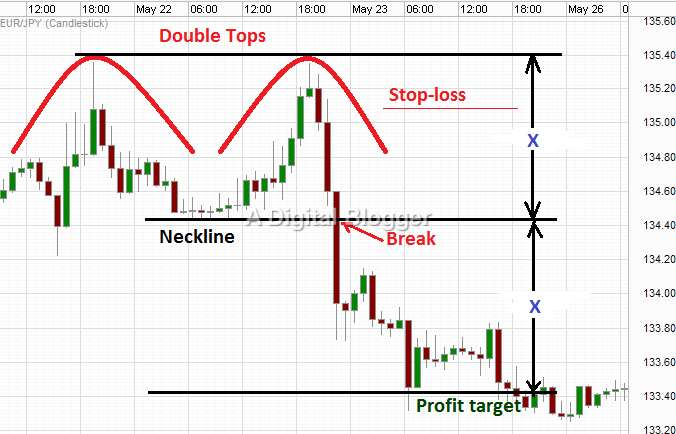
1. Double Top
Double Top is when the stock rejects the same level twice and then breaks below the neckline. You buy puts on the support break and stop out if it goes over the price it rejected at the top.
Double Top is when the stock rejects the same level twice and then breaks below the neckline. You buy puts on the support break and stop out if it goes over the price it rejected at the top.
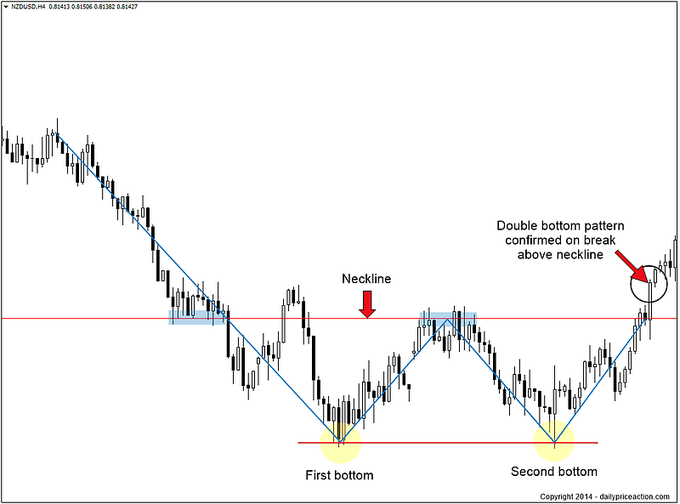
2. Double Bottom
A double bottom is the opposite of a double top. It is when the stock bounces 2 times off the same level and gets bought up. You buy calls on the next resistance break and stop out if it goes under the support.
A double bottom is the opposite of a double top. It is when the stock bounces 2 times off the same level and gets bought up. You buy calls on the next resistance break and stop out if it goes under the support.
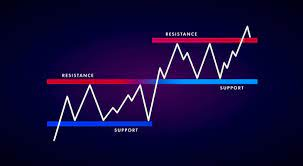
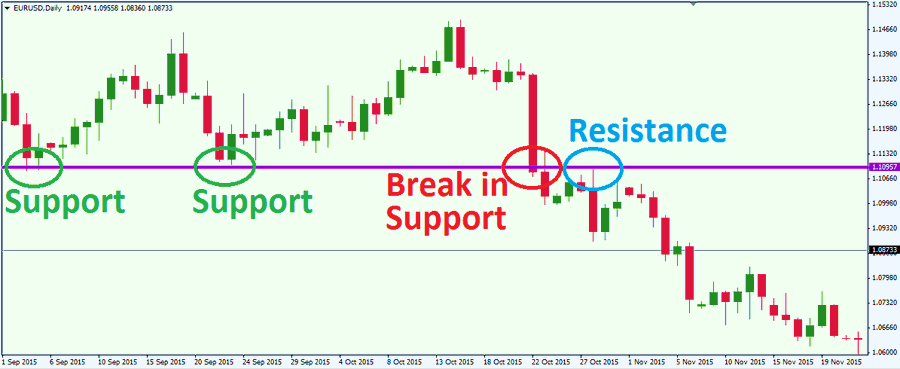
3. S/R Level
This is when a support becomes resistance or a resistance becomes a support.
The usual trade on these is playing the retest of the level after the breakout/breakdown.
This is when a support becomes resistance or a resistance becomes a support.
The usual trade on these is playing the retest of the level after the breakout/breakdown.
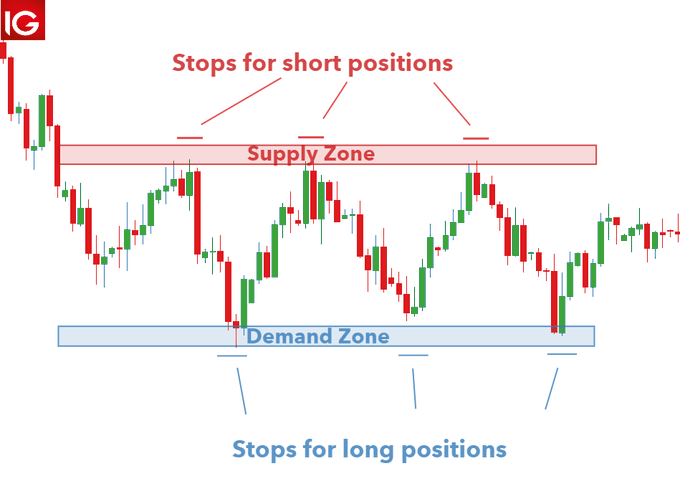
4. Demand Zone
Demand zone is where there is a lot of people buying a stock in a certain area.
This creates a consolidation zone which usually will result to buying off support.
I don't trade just off these zones but I do watch them in a trade to see what territory it is in.
Demand zone is where there is a lot of people buying a stock in a certain area.
This creates a consolidation zone which usually will result to buying off support.
I don't trade just off these zones but I do watch them in a trade to see what territory it is in.
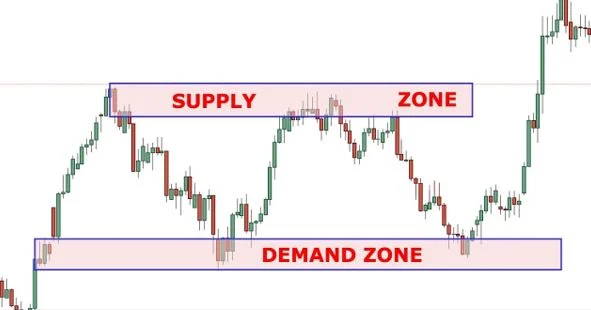
5. Supply Zone
Supply zone is where there is a lot of selling in an area. When you see lots of wicks in a certain zone and we can't break over a certain level then that is a supply zone.
What can happen is supply zone reject to a support breakdown = 📉
Supply zone is where there is a lot of selling in an area. When you see lots of wicks in a certain zone and we can't break over a certain level then that is a supply zone.
What can happen is supply zone reject to a support breakdown = 📉
6. Bearish Flag
A bearish flag is when a stock consolidates after a move down and then breaks below the consolidation zone. This is my favorite pattern to trade. Here is more context on it.
A bearish flag is when a stock consolidates after a move down and then breaks below the consolidation zone. This is my favorite pattern to trade. Here is more context on it.
7. SUPPORT
Support is a level that the stock is holding. If a stock is holding a certain level then that is the support. Support is like demand. Resistance is like supply. If we are holding a certain support and then break below it with confirmation then I short.
Support is a level that the stock is holding. If a stock is holding a certain level then that is the support. Support is like demand. Resistance is like supply. If we are holding a certain support and then break below it with confirmation then I short.
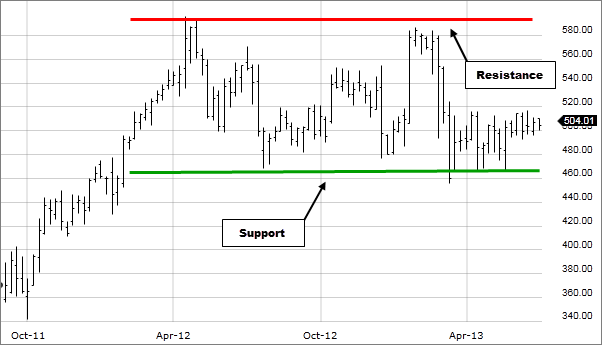
8. Resistance
Resistance is a price in the stock where there are a lot of sellers. Its a level that the stock cant get above because of the heavy selling. Once you see 3 taps/rejections off a level that is usually when you mark it as a resistance. I love trading res B/O retest
Resistance is a price in the stock where there are a lot of sellers. Its a level that the stock cant get above because of the heavy selling. Once you see 3 taps/rejections off a level that is usually when you mark it as a resistance. I love trading res B/O retest
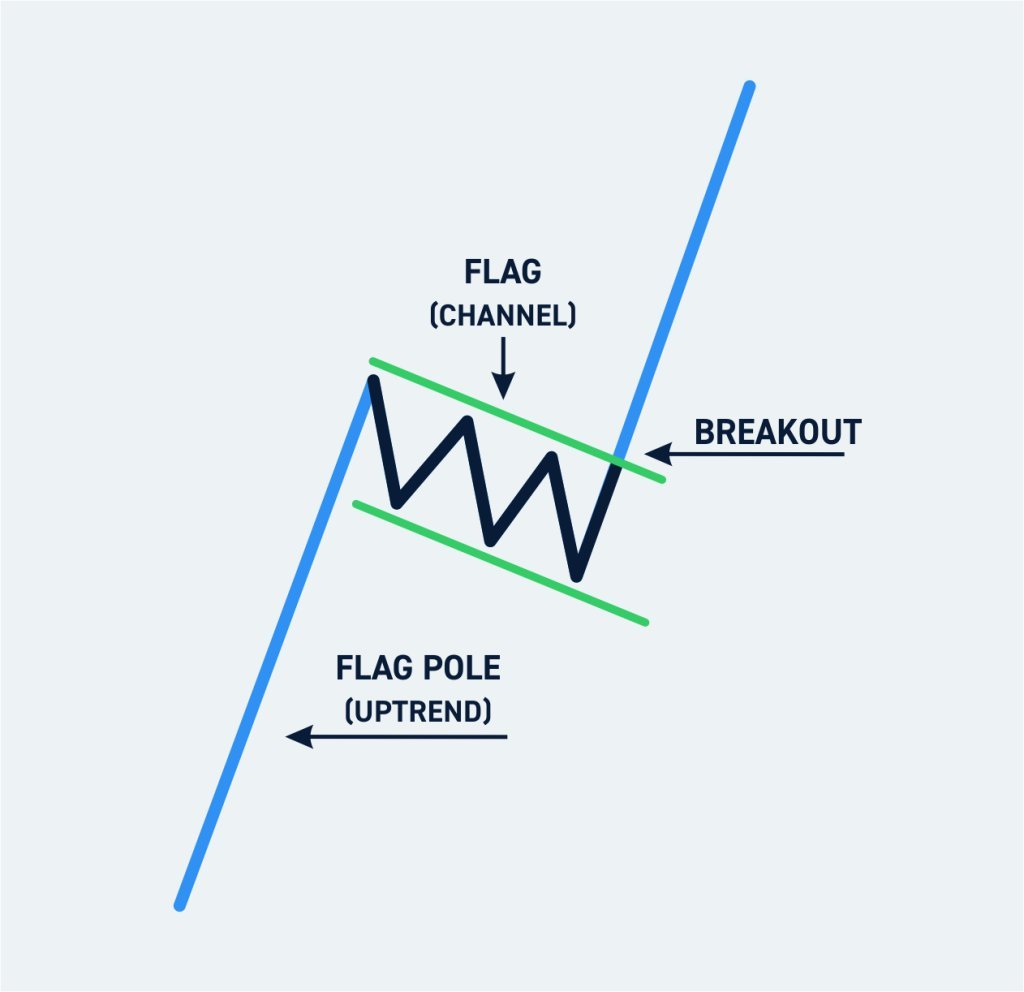
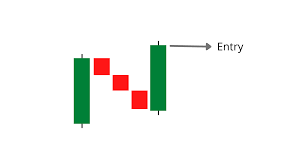
9. Bullish Flag
A bullish flag is when a stock consolidates in a range after a move up and then breaks out over the resistance. You buy over the resistance and stop out if it goes back under. Here is more info on bull flags 👇
A bullish flag is when a stock consolidates in a range after a move up and then breaks out over the resistance. You buy over the resistance and stop out if it goes back under. Here is more info on bull flags 👇
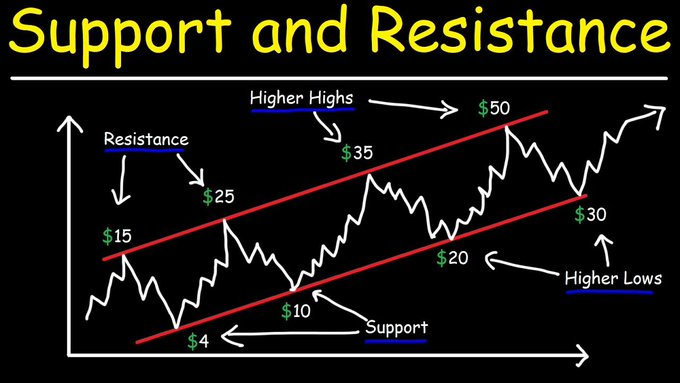
10. Higher Lows/ Higher Highs
This is when the stock is in a solid uptrend, dips are getting bought up and it is showing lots of strength.
This can either result in a breakout above the Higher High Trendline or a breakdown below the higher low trendline.
This is when the stock is in a solid uptrend, dips are getting bought up and it is showing lots of strength.
This can either result in a breakout above the Higher High Trendline or a breakdown below the higher low trendline.
I hope you guys enjoyed, if you did make sure to LIKE + RT the first tweet of this thread and follow me with NOTIS ON 🔔
Also check me out on IG (Link In Bio) I am way more active on there and post tons of free education!
Also check me out on IG (Link In Bio) I am way more active on there and post tons of free education!
Loading suggestions...