
𝗧𝗵𝗲 𝗦𝗲𝗰𝗿𝗲𝘁𝘀 𝗧𝗿𝗮𝗱𝗲𝗿𝘀 𝗗𝗼𝗻’𝘁 𝗪𝗮𝗻𝘁 𝗬𝗼𝘂 𝗧𝗼 𝗞𝗻𝗼𝘄.
Time to Learn 🧵
Time to Learn 🧵

** 𝗚𝗹𝗼𝘀𝘀𝗮𝗿𝘆 **
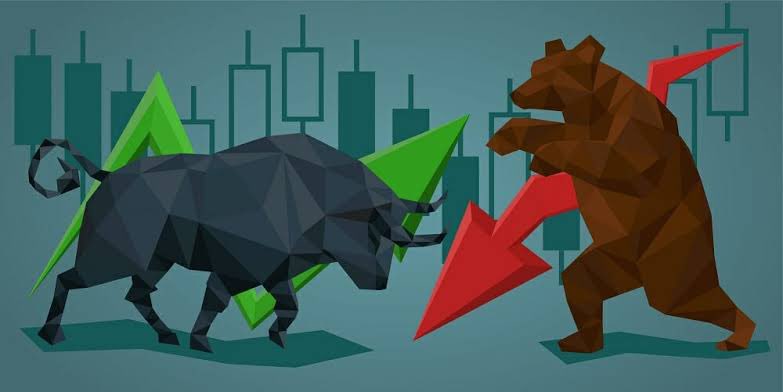
🟢Bull (ish) = Price is rising
🔴Bear (ish) = Price is falling
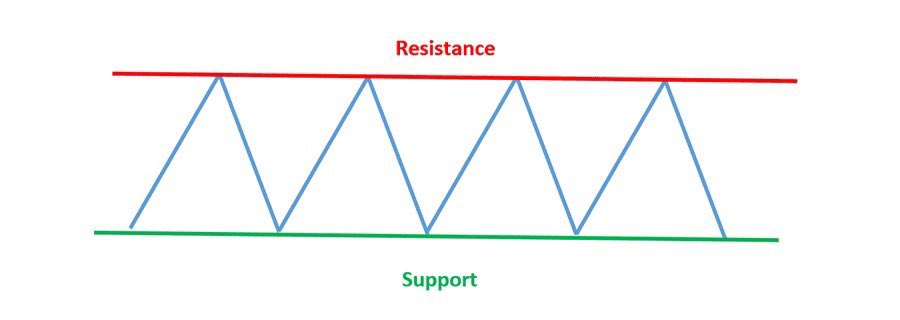
📈Resistance:
Price battles to move higher
📉Support:
Price holds at a certain level
🟢Bull (ish) = Price is rising
🔴Bear (ish) = Price is falling
📈Resistance:
Price battles to move higher
📉Support:
Price holds at a certain level
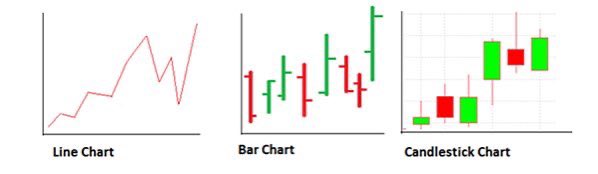
** 𝗖𝗵𝗮𝗿𝘁 𝗧𝘆𝗽𝗲𝘀 **
▪️Candlestick
▪️Line
▪️Bar
There are more, but these 3 are common.
We’ll be 𝗳𝗼𝗰𝘂𝘀𝗶𝗻𝗴 𝗼𝗻 𝗰𝗮𝗻𝗱𝗹𝗲𝘀𝘁𝗶𝗰𝗸𝘀 𝗶𝗻 𝘁𝗵𝗶𝘀 𝘁𝗵𝗿𝗲𝗮𝗱, as it is the most important and the easiest one to trade.
▪️Candlestick
▪️Line
▪️Bar
There are more, but these 3 are common.
We’ll be 𝗳𝗼𝗰𝘂𝘀𝗶𝗻𝗴 𝗼𝗻 𝗰𝗮𝗻𝗱𝗹𝗲𝘀𝘁𝗶𝗰𝗸𝘀 𝗶𝗻 𝘁𝗵𝗶𝘀 𝘁𝗵𝗿𝗲𝗮𝗱, as it is the most important and the easiest one to trade.
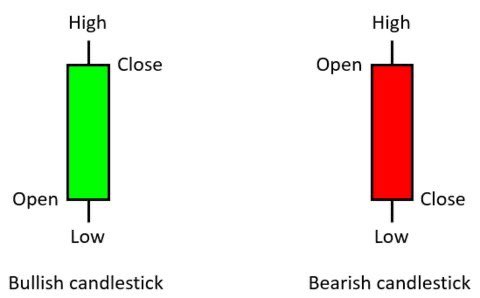
** 𝗖𝗮𝗻𝗱𝗹𝗲𝘀𝘁𝗶𝗰𝗸𝘀 𝗘𝘅𝗽𝗹𝗮𝗶𝗻𝗲𝗱 **
Before we start, we must know that a Stock Price movement consists of the following:
▪️Opening Price
▪️Closing Price
▪️High of the day
▪️Low of Day
Before we start, we must know that a Stock Price movement consists of the following:
▪️Opening Price
▪️Closing Price
▪️High of the day
▪️Low of Day
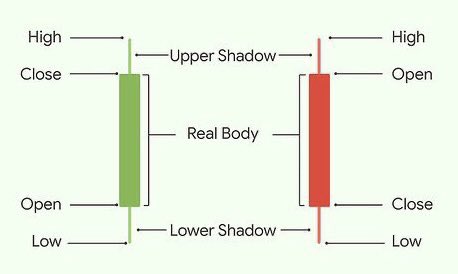
Now that we know how to identify the opening, closing, high and low parts on a candlestick.
We must also learn about
▪️Upper shadow
▪️Real Body
▪️Lower shadow
Look at the diagrams below 👇🏽
We must also learn about
▪️Upper shadow
▪️Real Body
▪️Lower shadow
Look at the diagrams below 👇🏽
Candlestick charts build patterns that predict price direction once completed.
𝗛𝗲𝗿𝗲 𝗮𝗿𝗲 𝟭𝟱 𝗺𝘂𝘀𝘁 𝗸𝗻𝗼𝘄 𝗰𝗮𝗻𝗱𝗹𝗲𝘀𝘁𝗶𝗰𝗸 𝗽𝗮𝘁𝘁𝗲𝗿𝗻𝘀
▪️Doji Star
▪️Morning Star
▪️Evening star
▪️Bullish Engulfing Candle
▪️Rising Three Method Pattern
▪️Bullish hammer
▪️Inverted hammer
▪️Shooting star
▪️Falling window
▪️Marubozu pattern
▪️Bull Flag
▪️Bear Flag
▪️Tri-Star Bullish Pattern
▪️Tri-Star Bearish Pattern
▪️Dark Cloud Cover
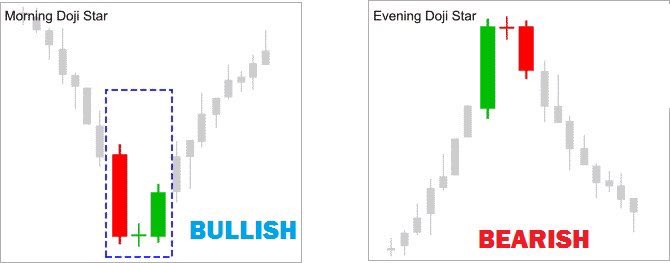
1/ Doji Star
It is when the opening and closing price of a security is almost the same. (Small real body)
It signals a potential reversal of a downtrend
(+ vice versa in a bullish trend ) 👇🏽
(It’s the candle stick in the middle)
Bullish Bearish
It is when the opening and closing price of a security is almost the same. (Small real body)
It signals a potential reversal of a downtrend
(+ vice versa in a bullish trend ) 👇🏽
(It’s the candle stick in the middle)
Bullish Bearish
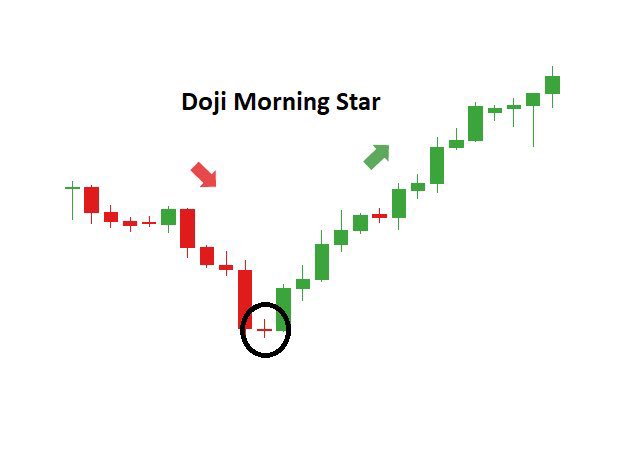
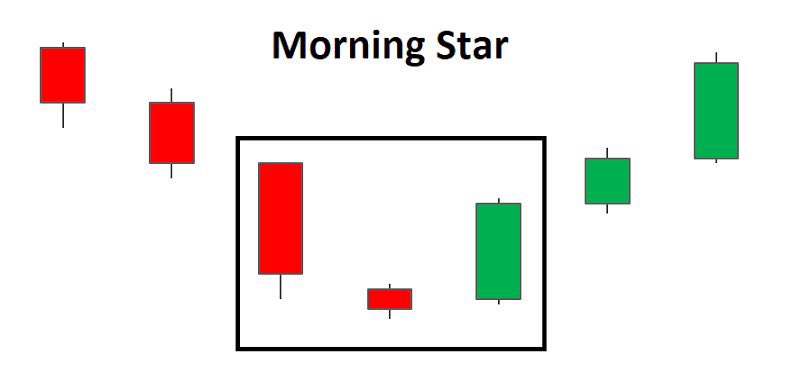
2/ Morning star
Is a bullish 3 candle pattern which is formed at the bottom of a move down.
Once you spot a doji, you wait for the 2nd green candle to give confirmation that it’s turning bullish, then you go long.
You set your stop loss at the previous red candles close.
Is a bullish 3 candle pattern which is formed at the bottom of a move down.
Once you spot a doji, you wait for the 2nd green candle to give confirmation that it’s turning bullish, then you go long.
You set your stop loss at the previous red candles close.
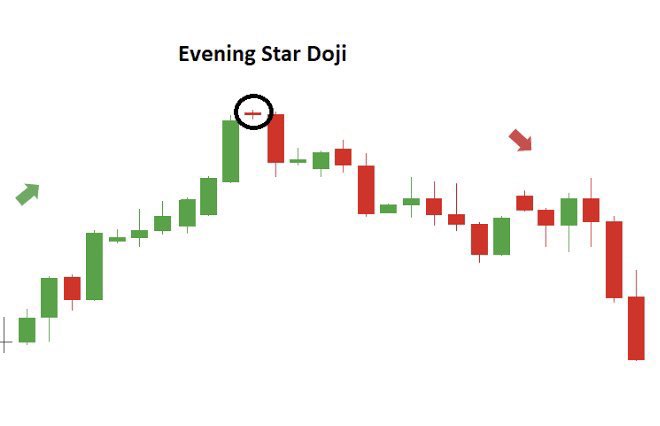
3/ Evening star
It’s the opposite of a morning star. It’s a bearish 3 candle pattern which is formed on the top of a move up.
Once you spot a doji in an uptrend, you wait for the second red candle and go short.
It’s the opposite of a morning star. It’s a bearish 3 candle pattern which is formed on the top of a move up.
Once you spot a doji in an uptrend, you wait for the second red candle and go short.
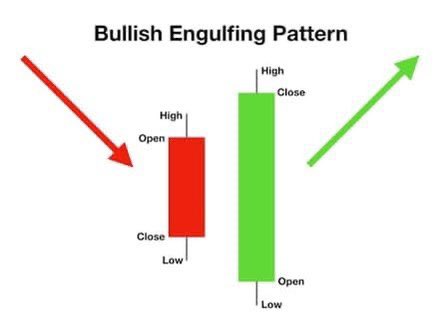
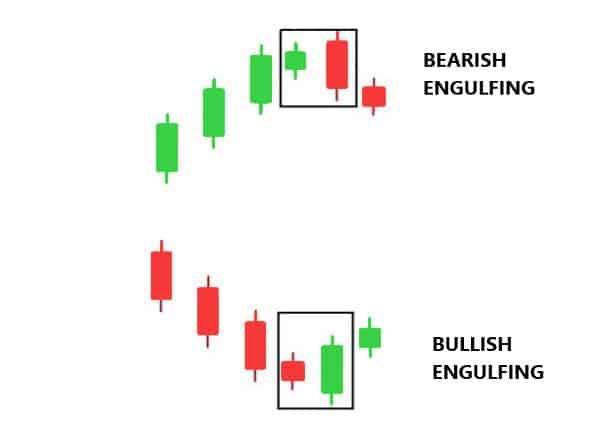
4/ Bullish Engulfing pattern
It opens lower than the previous days close, and then closes higher than the previous days open.
(+ vice versa for bearish )
A bullish reversal is more likely if the bearish trend is oversold. But can’t be reliant just on its own
Looks like this👇🏽
It opens lower than the previous days close, and then closes higher than the previous days open.
(+ vice versa for bearish )
A bullish reversal is more likely if the bearish trend is oversold. But can’t be reliant just on its own
Looks like this👇🏽
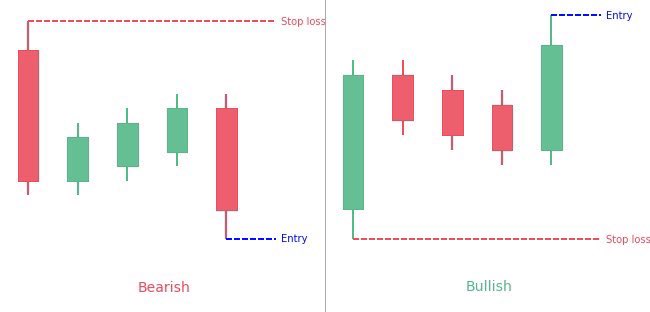
5/ Rising Three Methods Pattern
▪️Bullish
The bulls are in control before pausing to see if there is enough conviction in the uptrend.
The red candles are considered consolidation before moving up again in an existing uptrend.
Sellers have no control.
▪️Bearish
characterized by two long candlesticks in the direction of the trend, one at the beginning and end, with three shorter counter-trend candlesticks in the middle
This pattern shows traders that the bulls still don't have sufficient conviction to reverse the trend
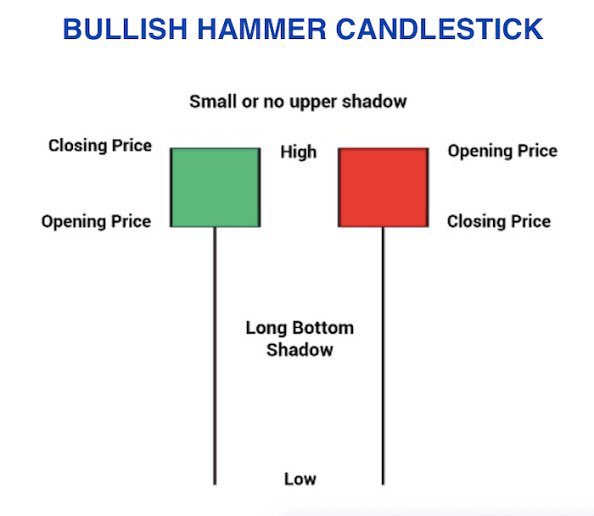
6/ Bullish Hammer
Hammer candlesticks typically occur after a price decline. They have a small real body and a long lower shadow
The lower shadow should be at least two times the height of the real body.
The price must start moving up following the hammer to confirm upside.
Hammer candlesticks typically occur after a price decline. They have a small real body and a long lower shadow
The lower shadow should be at least two times the height of the real body.
The price must start moving up following the hammer to confirm upside.
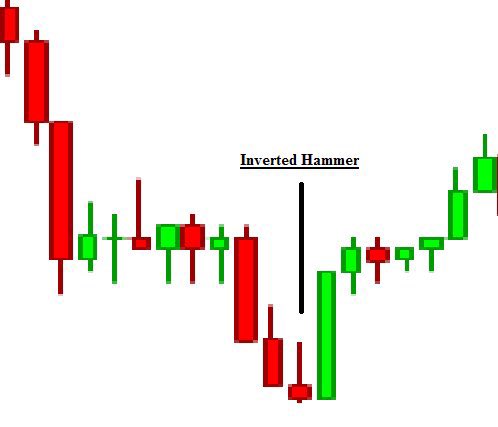
7/ Inverted Hammer
This is a bullish reversal pattern, it signals that a stock is nearing the bottom in a down trend.
The inverted hammer looks like an upside down version of the hammer candlestick pattern (above).
When it appears in an uptrend it is called a shooting star.
This is a bullish reversal pattern, it signals that a stock is nearing the bottom in a down trend.
The inverted hammer looks like an upside down version of the hammer candlestick pattern (above).
When it appears in an uptrend it is called a shooting star.
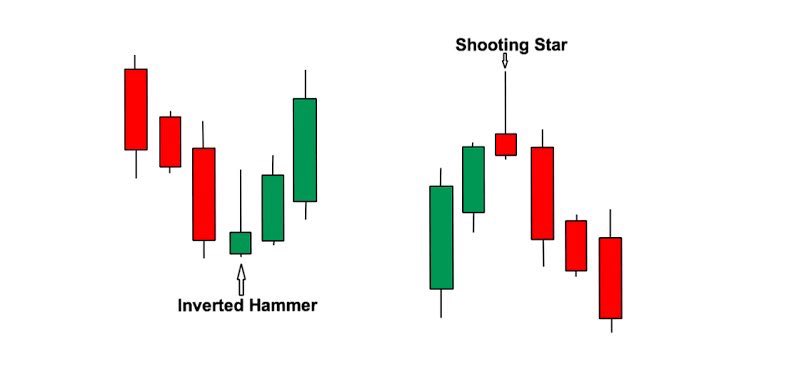
8/ Shooting star
On the right side of the image is a shooting star pattern, it is the opposite of an inverted hammer.
It presents itself in an uptrend and usually precedes falling prices.
On the right side of the image is a shooting star pattern, it is the opposite of an inverted hammer.
It presents itself in an uptrend and usually precedes falling prices.
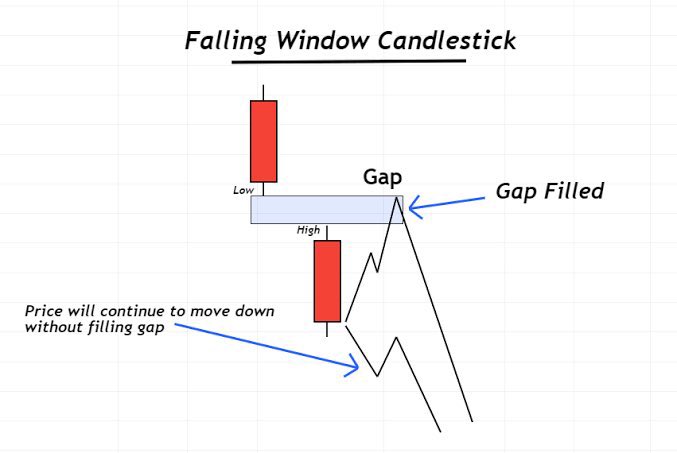
9/ Falling window
Ever see those gaps in a share price?
It usually happens in a downtrend
It happens when yesterday's low is above today's high, leaving a hole on the daily price chart.
This is a bearish continuation pattern
Ever see those gaps in a share price?
It usually happens in a downtrend
It happens when yesterday's low is above today's high, leaving a hole on the daily price chart.
This is a bearish continuation pattern
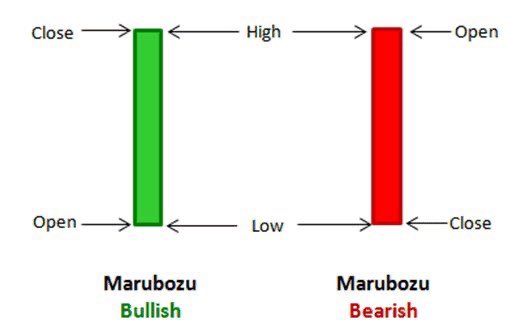
10/ Marubozu pattern
Marubozu means ‘dominance’
The close of the day is equal to the high of the day.
It’s a strong bullish sign, the stock opened and kept rising for the day.
Vice versa for a bearish trend, I use it as a signal that the uptrend is going to continue.
Marubozu means ‘dominance’
The close of the day is equal to the high of the day.
It’s a strong bullish sign, the stock opened and kept rising for the day.
Vice versa for a bearish trend, I use it as a signal that the uptrend is going to continue.
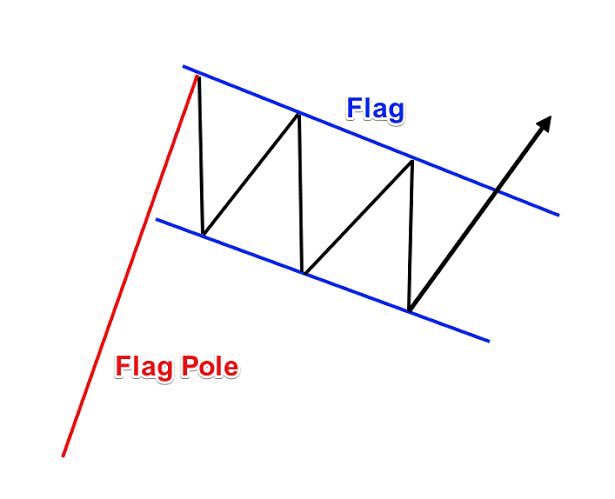
11/ Bull Flag
It literally looks like a flag poll and the flag.
It is a continuation pattern of an existing uptrend, it consolidates in the opposite direction of the trend and then breaks out.
It literally looks like a flag poll and the flag.
It is a continuation pattern of an existing uptrend, it consolidates in the opposite direction of the trend and then breaks out.

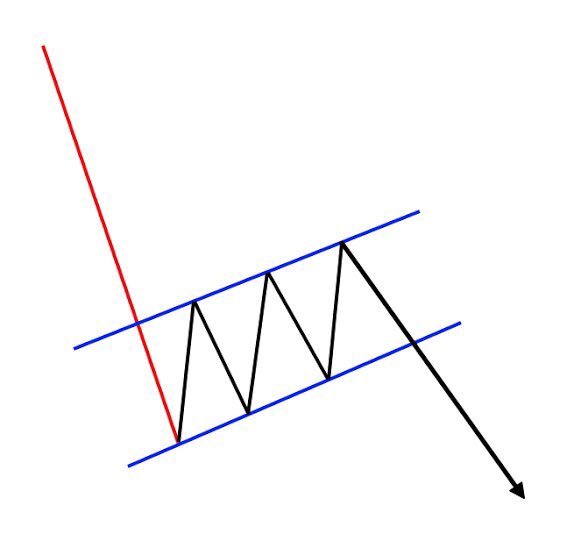
12/ Bear Flag
A bear flag is the opposite of a bull flag. It is the continuation pattern of an existing down trend.
This formation is a strong move down and then followed by consolidation channel upwards before breaking lower again.
A bear flag is the opposite of a bull flag. It is the continuation pattern of an existing down trend.
This formation is a strong move down and then followed by consolidation channel upwards before breaking lower again.
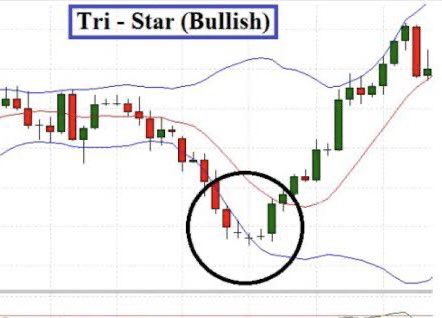
13/ Tri-Star Bullish Pattern
It consists of 3 candles stick lines. All 3 are doji candles. The middle doji is below the other two
A tri-star pattern near a significant support level gives a better confirmation of a reversal of a prolonged downtrend.
Example 👇🏽
It consists of 3 candles stick lines. All 3 are doji candles. The middle doji is below the other two
A tri-star pattern near a significant support level gives a better confirmation of a reversal of a prolonged downtrend.
Example 👇🏽
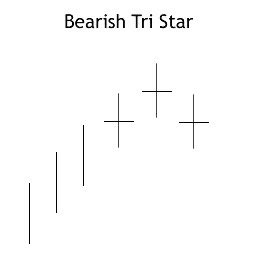
14/ Tri-Star Bearish Pattern
This is the opposite of a Tri-Star bullish pattern.
It signals a reversal in the current trend.
A tri-star pattern near a significant resistance level increases your chances of a successful trade.
This is the opposite of a Tri-Star bullish pattern.
It signals a reversal in the current trend.
A tri-star pattern near a significant resistance level increases your chances of a successful trade.

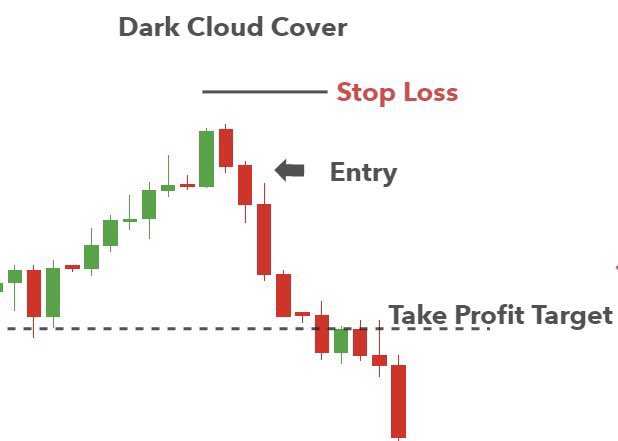
15/ Dark Cloud Cover
There is a storm coming, this is a bearish reversal pattern,
It opens above the close of the prior candle and then closes below the midpoint of the green candle.
There is a storm coming, this is a bearish reversal pattern,
It opens above the close of the prior candle and then closes below the midpoint of the green candle.
That’s it, that’s the tweet.
Follow me @talkcentss for more
Follow me @talkcentss for more
Loading suggestions...