

Volume On Different Timeframes
🧵👇
🧵👇

Volume is something I use for EVERY trade, and being able to use different timeframes is key
Smaller timeframes will give you a direct look into where the volume came from
Larger timeframes will give you a look at the bigger picture & end result
Smaller timeframes will give you a direct look into where the volume came from
Larger timeframes will give you a look at the bigger picture & end result
Like and share this thread ♥️🔁
Don't be a freeloader
Don't be a freeloader

This thread is going to be broken up into 2 main categories
1) Swing Trading
2) Scalping
They will be similar techniques, but different timeframes
1) Swing Trading
2) Scalping
They will be similar techniques, but different timeframes
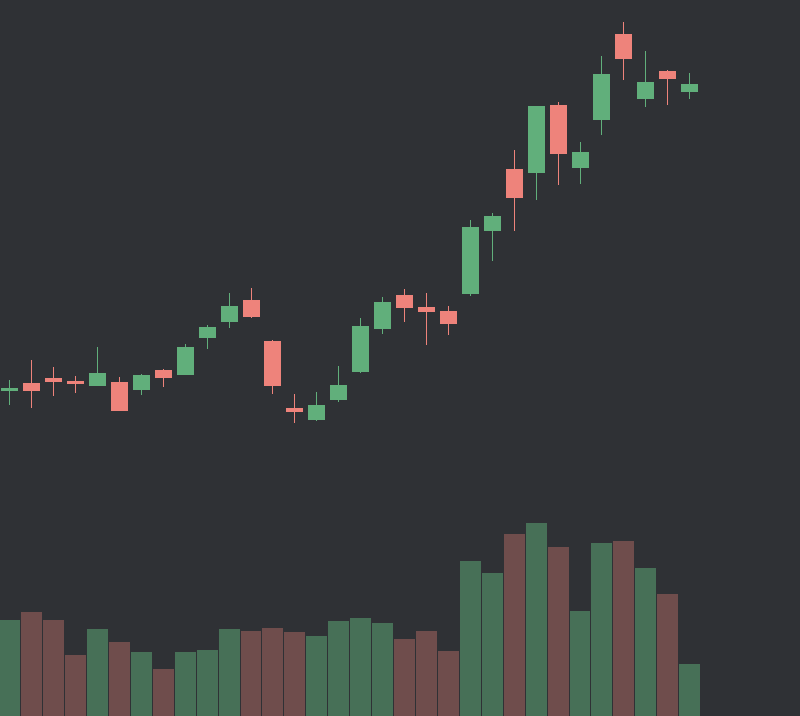
Swing Trading Daily
Most people begin on the Daily chart. This will give you a general idea of how the current volume compares to the last few weeks
The recent/current volume is much higher then the last few weeks. This tells us the price action is significant
Most people begin on the Daily chart. This will give you a general idea of how the current volume compares to the last few weeks
The recent/current volume is much higher then the last few weeks. This tells us the price action is significant
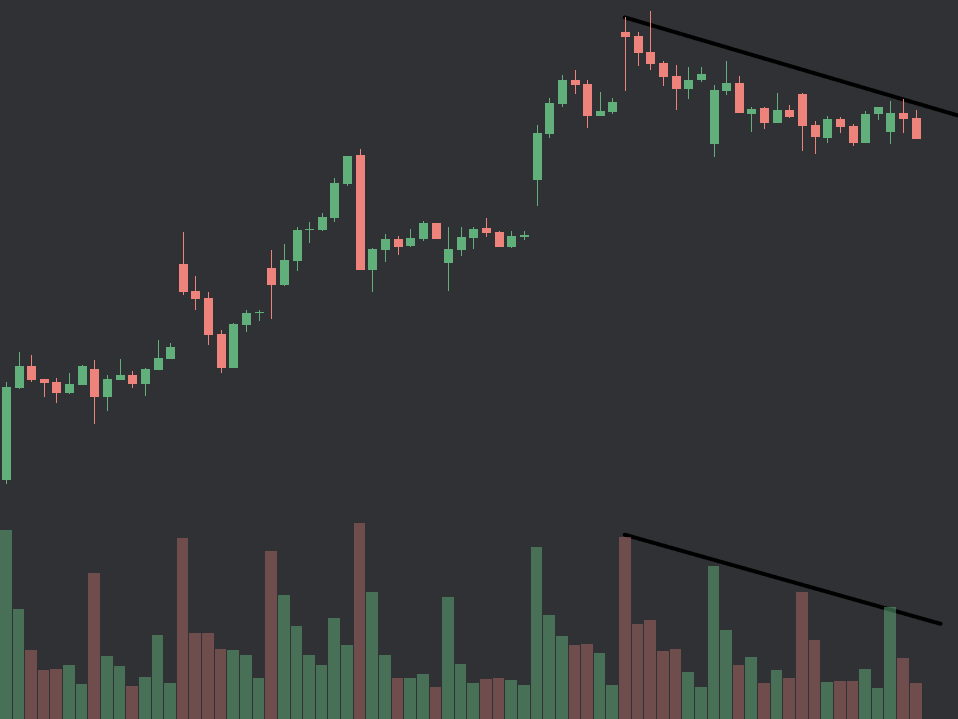
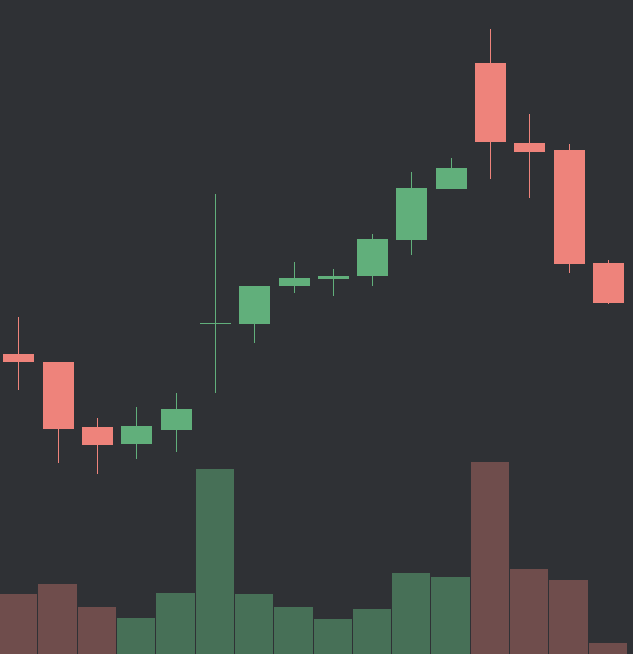
Swing Trading Hourly
Now that we know the recent price has been significant, I move down to the hourly to see which sentiment has been more successful
Volume was high when price was trending up. Volume is declining as price pulls back. This is a good sign for the bulls
Now that we know the recent price has been significant, I move down to the hourly to see which sentiment has been more successful
Volume was high when price was trending up. Volume is declining as price pulls back. This is a good sign for the bulls
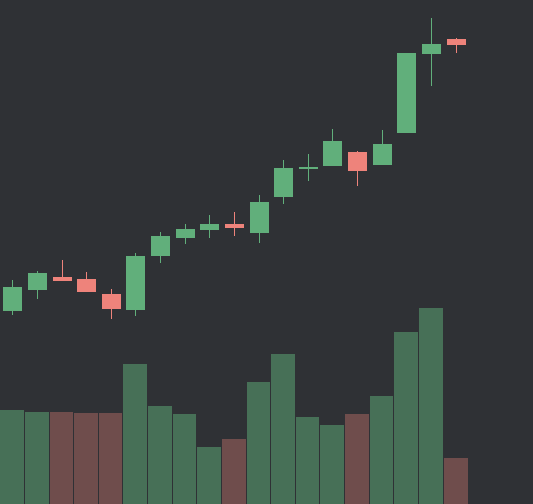
Swing Trading Weekly
Before I made a decision (bullish or bearish) I always check a higher timeframe as well. In this case, I prefer the weekly
Bulls have been pairing volume spikes with strong candles UNTIL last week's indecision candle (bullish leaning)
Before I made a decision (bullish or bearish) I always check a higher timeframe as well. In this case, I prefer the weekly
Bulls have been pairing volume spikes with strong candles UNTIL last week's indecision candle (bullish leaning)
Overall Analysis
The Daily shows us that the previous 2 weeks have been significant
The Hourly shows us bulls have been holding the trend, and the current pullback has declining volume
The Weekly shows us bulls had control until last week when bears put up a fight
The Daily shows us that the previous 2 weeks have been significant
The Hourly shows us bulls have been holding the trend, and the current pullback has declining volume
The Weekly shows us bulls had control until last week when bears put up a fight
Final Verdict
The action is significant (as shown on the daily), the uptrend has been strong (as shown on the weekly), and this recent pullback is lower volume (as shown on the hourly)
I consider this chart to be bullish after comparing the timeframes & volume + price
The action is significant (as shown on the daily), the uptrend has been strong (as shown on the weekly), and this recent pullback is lower volume (as shown on the hourly)
I consider this chart to be bullish after comparing the timeframes & volume + price
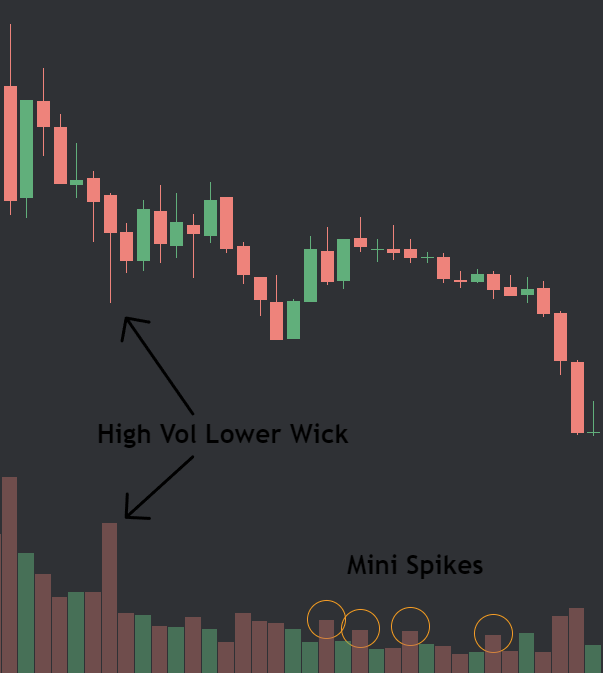
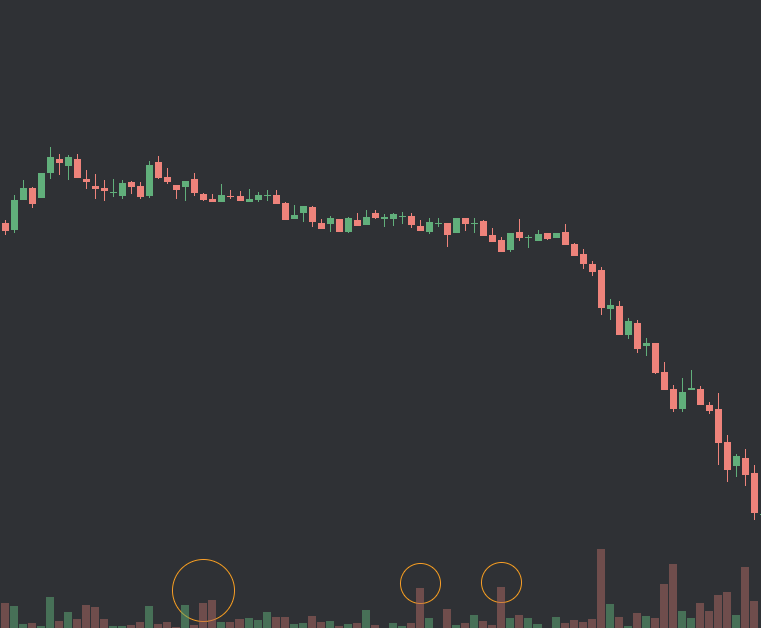
Scalping 5 Min
The overall trend is bearish, but earlier this morning we saw a very high volume red candle with a long lower wick
We also saw mini spikes during consolidation before this selloff. Let's examine the 1 min to see where the volume really came from
The overall trend is bearish, but earlier this morning we saw a very high volume red candle with a long lower wick
We also saw mini spikes during consolidation before this selloff. Let's examine the 1 min to see where the volume really came from
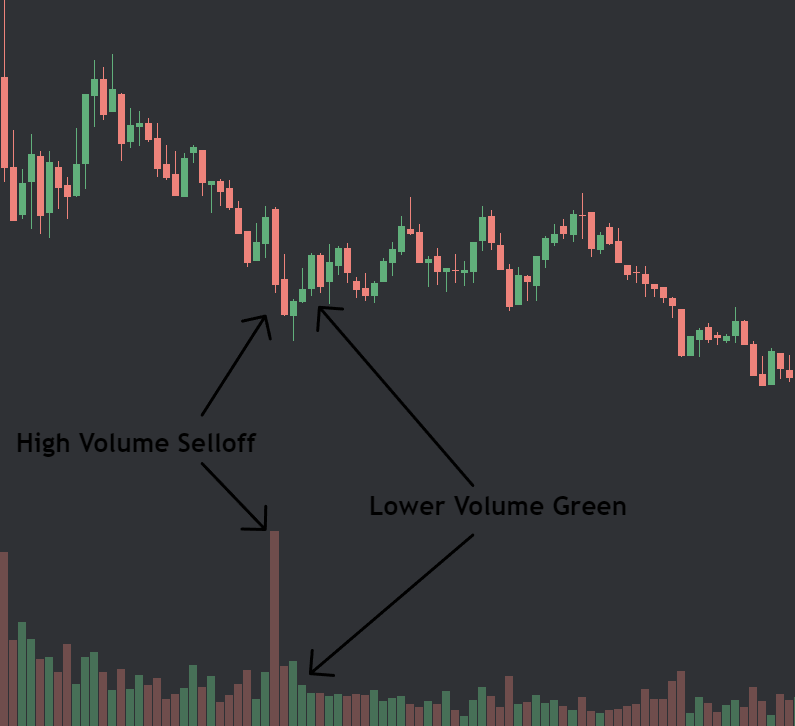
Scalping 1 min
The 1 min allows us to see the volume WITHIN those 5 minute candles. You can see on the 'long lower wick' candle most of the volume occurred on a selloff candle
During the consolidation period, most of the volume spikes occurred on bearish candles
The 1 min allows us to see the volume WITHIN those 5 minute candles. You can see on the 'long lower wick' candle most of the volume occurred on a selloff candle
During the consolidation period, most of the volume spikes occurred on bearish candles
Scalping Hourly
The hourly will give us the 'big picture'. The 1 & 5 min action happened WITHIN the 4 red candles on this hourly
We rejected highs with high volume & the move has continued on average volume
The hourly will give us the 'big picture'. The 1 & 5 min action happened WITHIN the 4 red candles on this hourly
We rejected highs with high volume & the move has continued on average volume
Overall Analysis
The 5 min shows us a volume spike on a lower wick & mini spikes on red candles during consolidation
The 1 min shows us the volume spike was created by a selloff & consolidation spikes were bearish
The hourly shows us the selloff is at new highs
The 5 min shows us a volume spike on a lower wick & mini spikes on red candles during consolidation
The 1 min shows us the volume spike was created by a selloff & consolidation spikes were bearish
The hourly shows us the selloff is at new highs
Final Verdict
The significant action (found using 5 min) was proven to be bearish (found using 1 min). These setups occurred before the selloff. They indicated bearish, and they were right
The move already happened, but bears are still in control of the volume + price
The significant action (found using 5 min) was proven to be bearish (found using 1 min). These setups occurred before the selloff. They indicated bearish, and they were right
The move already happened, but bears are still in control of the volume + price
My Thoughts
-Use smaller timeframes to further analyze the volume spikes from larger timeframes
-Use larger timeframes to determine who is having overall success
-Look for volume trend changes
-Basically make sure the timeframes line up one direction
-It wont work every time
-Use smaller timeframes to further analyze the volume spikes from larger timeframes
-Use larger timeframes to determine who is having overall success
-Look for volume trend changes
-Basically make sure the timeframes line up one direction
-It wont work every time
I hope you learned something useful from this thread!!
If you want to join a close knit trading group, check out my discord. Here is the link:
upgrade.chat
If you want to join a close knit trading group, check out my discord. Here is the link:
upgrade.chat

Loading suggestions...