

The math behind Linear Regression clearly explained:
Linear Regression tries to predict the Y variable from X using a linear relationship.
The linear relationship can be visualized as a line.
Mathematically we can write down lines like this 🔽
1/6
The linear relationship can be visualized as a line.
Mathematically we can write down lines like this 🔽
1/6
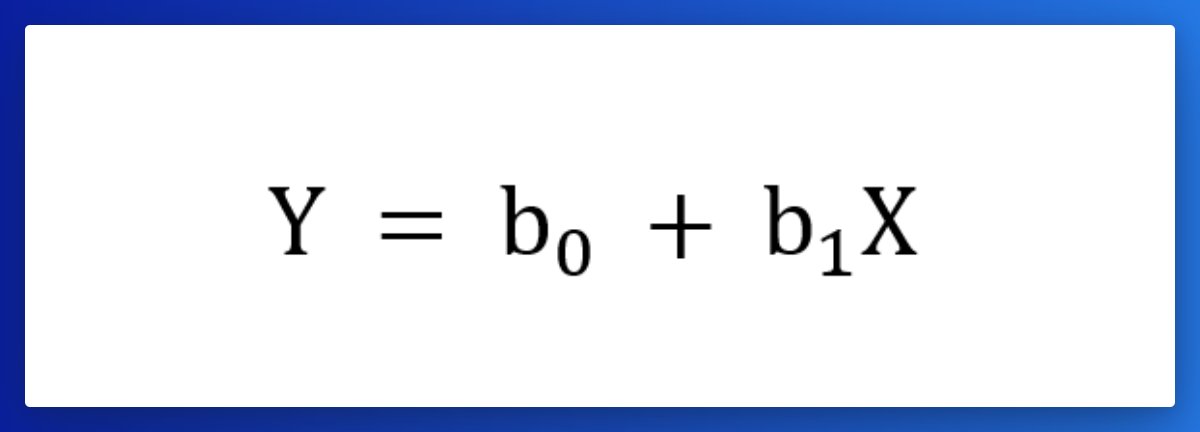
In the formula:
- b0 is the point where the line intercepts the y-axis.
- b1 is the slope of the line.
When the slope is 0.5, it means that when we walk along this line, for every unit that we move to the right, we are moving 0.5 units up.
2/6
- b0 is the point where the line intercepts the y-axis.
- b1 is the slope of the line.
When the slope is 0.5, it means that when we walk along this line, for every unit that we move to the right, we are moving 0.5 units up.
2/6

To find the perfect line the model modifies the b0 and b1 parameters.
It can
- Rotate (increase or decrease slope)
- Translate up and down (modify the y-intercept)
The model does this process until it finds the line that is closest to all the points in the dataset.
3/6
It can
- Rotate (increase or decrease slope)
- Translate up and down (modify the y-intercept)
The model does this process until it finds the line that is closest to all the points in the dataset.
3/6
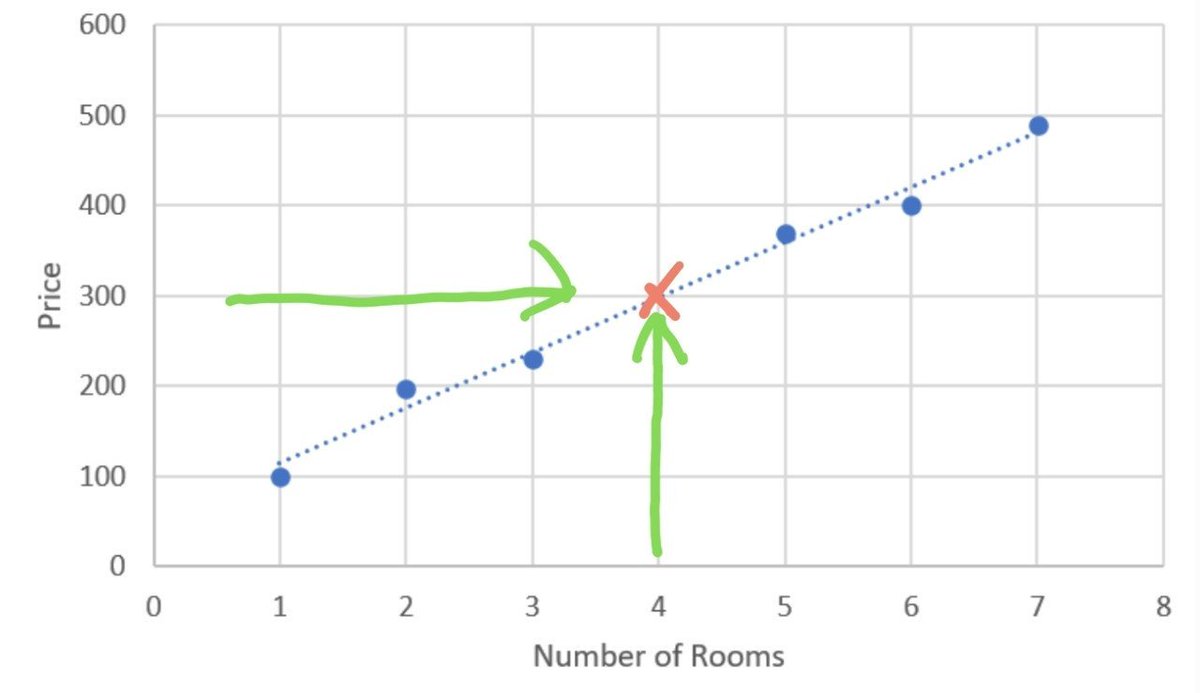
Using the House price example yesterday we
- draw the regression line
- figured out that the price of a house with 4 rooms will be around 300
4/6
- draw the regression line
- figured out that the price of a house with 4 rooms will be around 300
4/6
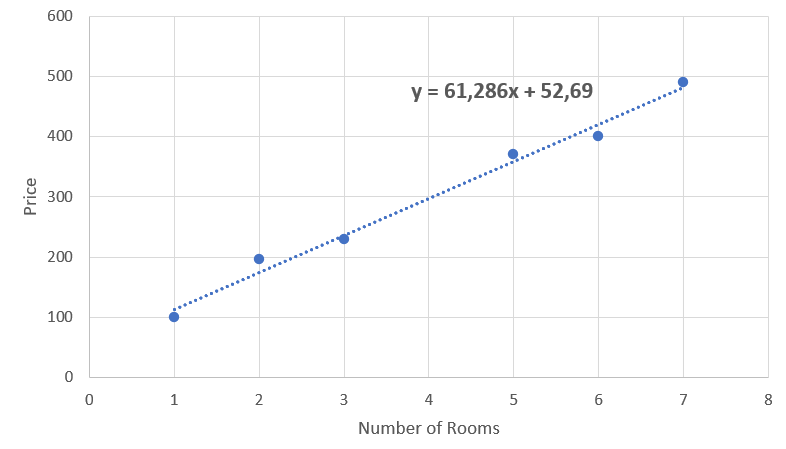
The equation for this line is:
y = 61,286x + 52,69
Remember:
Y - the predicted value
x - the attribute = 4
b0 - y-intercept = 52,69
b1 - slope = 61,286
After plugging in:
297.834 = 61.286 (4) + 52.69
The predicted price for a house with 4 rooms is 297.834
5/6
y = 61,286x + 52,69
Remember:
Y - the predicted value
x - the attribute = 4
b0 - y-intercept = 52,69
b1 - slope = 61,286
After plugging in:
297.834 = 61.286 (4) + 52.69
The predicted price for a house with 4 rooms is 297.834
5/6
That's it for today.
I hope you've found this thread helpful.
Like/Retweet the first tweet below for support and follow @levikul09 for more Data Science threads.
Thanks 😉
6/6
I hope you've found this thread helpful.
Like/Retweet the first tweet below for support and follow @levikul09 for more Data Science threads.
Thanks 😉
6/6
If you haven't already, join our newsletter DSBoost.
We share:
• Interviews
• Podcast notes
• Learning resources
• Interesting collections of content
dsboost.dev
We share:
• Interviews
• Podcast notes
• Learning resources
• Interesting collections of content
dsboost.dev

Loading suggestions...