

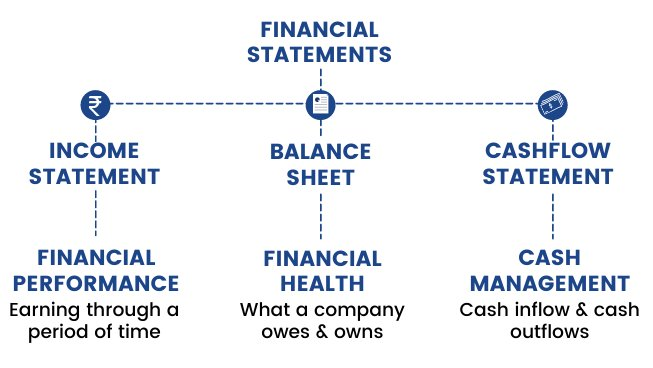
Every investor must know how to analyze:
• Balance Sheets
• Income Statements
• Cash Flow Statements
Here’s how to analyze and interpret the 3 financial statements in less than 3 minutes:
• Balance Sheets
• Income Statements
• Cash Flow Statements
Here’s how to analyze and interpret the 3 financial statements in less than 3 minutes:
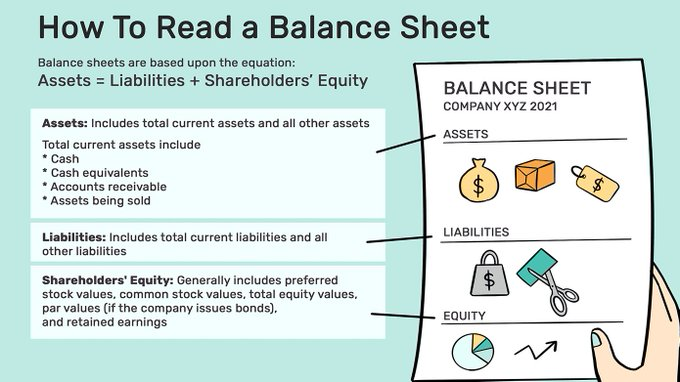
1. The Balance Sheet
A snapshot of a company's financial position at a specific point in time.
It details what the company owns and owes.
a. Assets: Things you own that have value, like cash, investments, or property.
b. Liabilities: Things you owe, such as loans or credit card debt.
c. Equity: This is what's left for the company's owners after paying off all the debts.
From the balance sheet, you can quickly evaluate a company's liquidity, financial flexibility, and capital structure.
2. In the Balance Sheet look at:
a. Cash & Cash Equivalents - Higher is better, it shows liquidity to pay short-term obligations.
b. Accounts Receivable - Growing means higher sales, but high levels can mean poor collections.
c. Inventory - Rising inventory can signal growth prospects but also obsolescence risk.
d. Accounts Payable - Can signal strong supplier relationships and creditworthiness.
e. Debt Levels - Rising long-term debt can signal growth but also high-interest costs.
f. Working Capital - Current assets minus current liabilities. Positive working capital indicates short-term health.
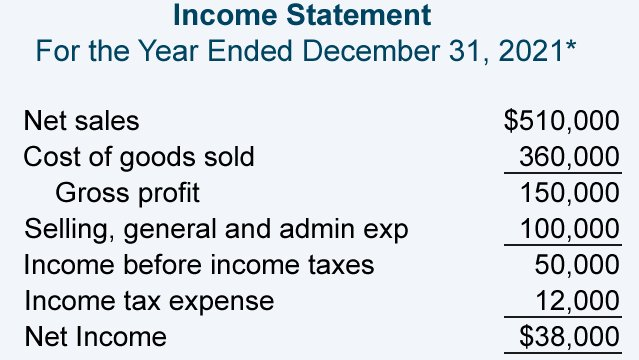
3. The Income Statement
Summarizes a company's financial performance over a specific time.
It shows revenues earned and expenses incurred.
a. Revenue: Money you make from sales.
b. Expenses: Costs you incur to run your business
Analyzing trends in the income statement can show the strengths and weaknesses in a company's operations and profitability.
4. In the Income Statement look at:
a. Revenue Growth - Rising revenues show increasing demand, and market share gains.
b. Gross Margin Trends - Improving margins means greater profitability of sales.
c. SG&A Expense - Rising generally indicates higher overhead costs.
d. Net Income - The bottom line profitability to shareholders. Look for steady growth.
e. Earnings Per Share - Rising EPS typically lifts share prices.
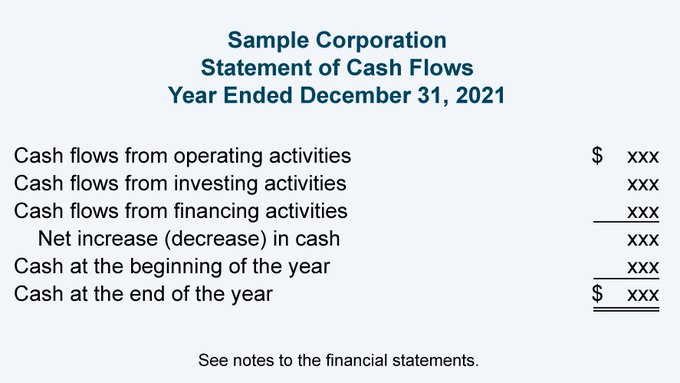
5. The Cash Flow Statement
Shows the actual cash flowing in and out of the company from operating, investing, and financing activities.
a. Operating Activities: Cash generated or used in the day-to-day operations of your business, like buying inventory or paying employees.
b. Investing Activities: Cash spent on investments, like buying new equipment or selling stocks.
c. Financing Activities: Cash from borrowing or repaying loans, or issuing and buying back stock.
The cash flow statement helps determine the short-term viability of the company's cash position.
6. In the Cash Flow Statement look at:
a. Cash from Operations - Rising cash from operations means stronger core business, and ability to self-fund.
b. Capital Expenditures - Growing CAPEX could signal expansion, and innovation.
c. Free Cash Flow - Higher free cash flow allows dividend payments, and buybacks.
d. Cash from Financing - Could indicate a company taking on more debt.
Every investor must know how to use financial ratios to learn the story behind the numbers.
Here’s how to analyze and interpret financial ratios:
Here’s how to analyze and interpret financial ratios:
7. Current Ratio
The ratio of current assets to current liabilities.
It measures the company’s ability to pay its short-term obligations.
A current ratio of more than one means the company has enough current assets to cover its current liabilities.
A current ratio of less than one means the company may have liquidity problems.
8. Debt-to-Equity Ratio
The ratio of total debt to total equity.
It measures the company’s leverage, or how much it relies on debt to finance its operations.
A high debt-to-equity ratio means the company has a lot of debt, which increases its risk and interest expenses.
A low debt-to-equity ratio means the company has more equity, which reduces its risk and cost of capital.
9. Return on Equity
The ratio of net income to total equity.
It measures the company’s profitability, or how much it earns on its shareholders’ investment.
A high return on equity means the company is generating a lot of income from its equity.
A low return on equity means the company is not using its equity efficiently.
10. Revenue Growth
Te percentage change in revenue from one period to another.
It measures the company’s sales performance, or how much it increased or decreased its sales.
A positive revenue growth means the company is selling more of its products or services.
A negative revenue growth means the company is selling less of its products or services.
11. Gross Profit Margin
The ratio of gross profit to revenue.
It measures the company’s cost efficiency, or how much it keeps from each dollar of sales after paying for the cost of goods sold.
A high gross profit margin means the company has a low cost of goods sold, which gives it more room to cover its other expenses and earn a profit.
A low gross profit margin means the company has a high cost of goods sold, which leaves it with less room to cover its other expenses and earn a profit.
12. Net Profit Margin
The ratio of net income to revenue.
It measures the company’s overall profitability, or how much it keeps from each dollar of sales after paying for all its expenses.
A high net profit margin means the company is earning a lot of income from its revenue.
A low net profit margin means the company is earning little income from its revenue.
13. Free Cash Flow
The amount of cash the company has left after paying for its capital expenses, such as buying or maintaining property, plant, and equipment.
It measures the company’s financial flexibility, or how much cash it has available to invest in growth opportunities, pay dividends, or reduce debt.
A positive free cash flow means the company has excess cash to use for these purposes.
A negative free cash flow means the company has insufficient cash to use for these purposes.
14. Free Cash Flow Yield
The ratio of free cash flow to market cap.
It measures the company’s valuation, or how much cash it generates relative to its market value.
A high free cash flow yield means the company is undervalued, or its market value is low compared to its cash generation.
A low free cash flow yield means the company is overvalued, or its market value is high compared to its cash generation.
15. Cash Flow from Operations
The amount of cash the company generated from its core business activities.
It measures the company’s operational performance, or how much cash it produces from its sales and expenses.
A positive cash flow from operations means the company is generating more cash than it spends on its operations.
A negative cash flow from operations means the company is spending more cash than it generates from its operations.
Financial statements are crucial for understanding financial performance.
If you liked this thread please:
1. 🔁RT it to share it with others
2. Follow me @FluentInFinance for daily tips
3. Join my 50,000+ newsletter readers at TheFinanceNewsletter.com for weekly tips
If you liked this thread please:
1. 🔁RT it to share it with others
2. Follow me @FluentInFinance for daily tips
3. Join my 50,000+ newsletter readers at TheFinanceNewsletter.com for weekly tips
👋 If you liked this post, you'll love my weekly newsletter ― Join 50,000 readers and subscribe at TheFinanceNewsletter.com!
Loading suggestions...