

Introducing the Dynamic RTH Gap [Pro+], a precision tool specifically crafted for day traders and analysts looking to master Regular Trading Hours (RTH) gaps with dynamic visuals, data insights, and style customizations.

Dynamic Color Fading for Gap Tracking
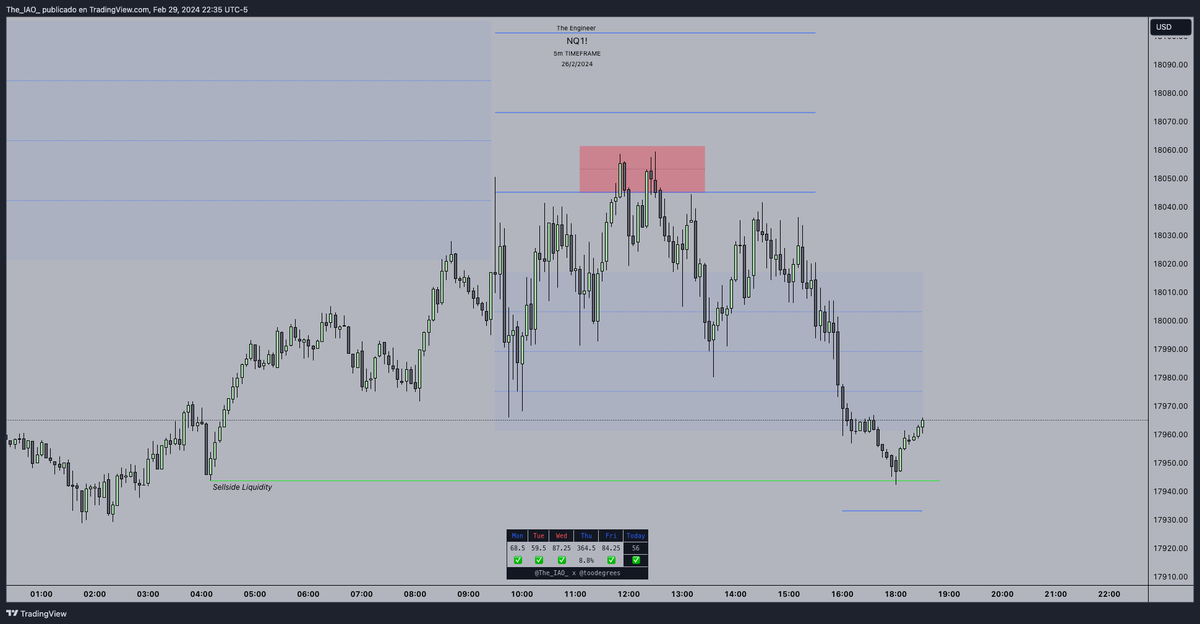
Introducing the Dynamic Color Fading feature: as gaps begin to fill, watch the intensity of the color fade, providing a visual cue to the degree of the gap being filled.
Introducing the Dynamic Color Fading feature: as gaps begin to fill, watch the intensity of the color fade, providing a visual cue to the degree of the gap being filled.
Proximity Gap Liquidity Tracking
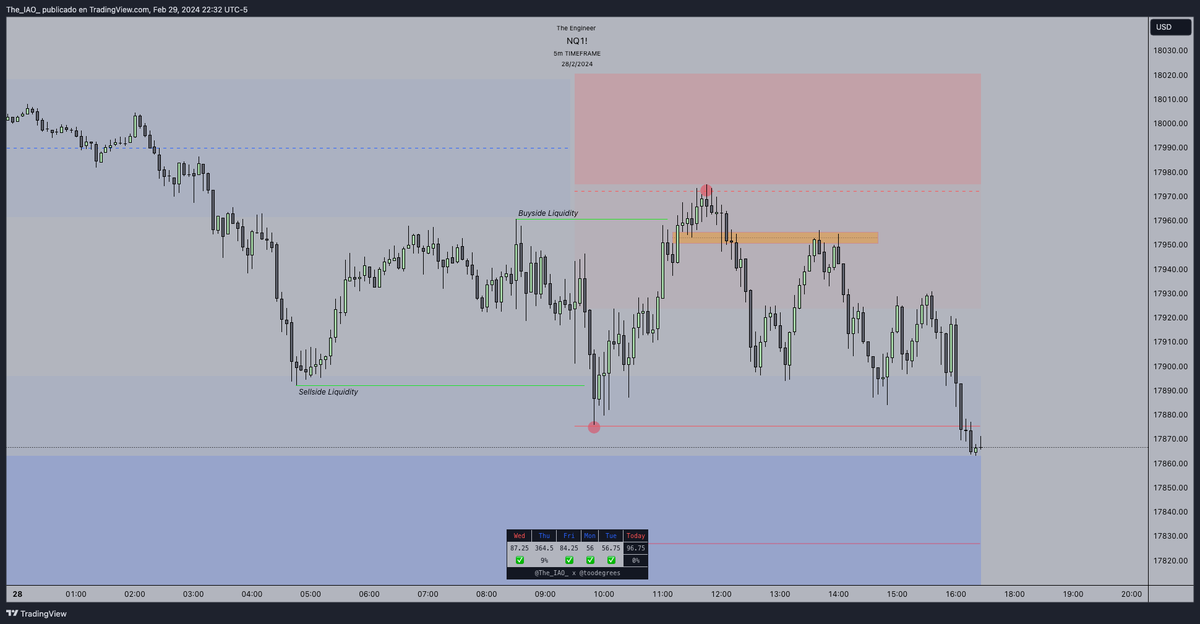
This feature enhances liquidity analysis by identifying the nearest unfilled gaps following RTH gap closures. When price action extends beyond a filled RTH gap, the tool automatically highlights the closest proximity gaps.
This feature enhances liquidity analysis by identifying the nearest unfilled gaps following RTH gap closures. When price action extends beyond a filled RTH gap, the tool automatically highlights the closest proximity gaps.
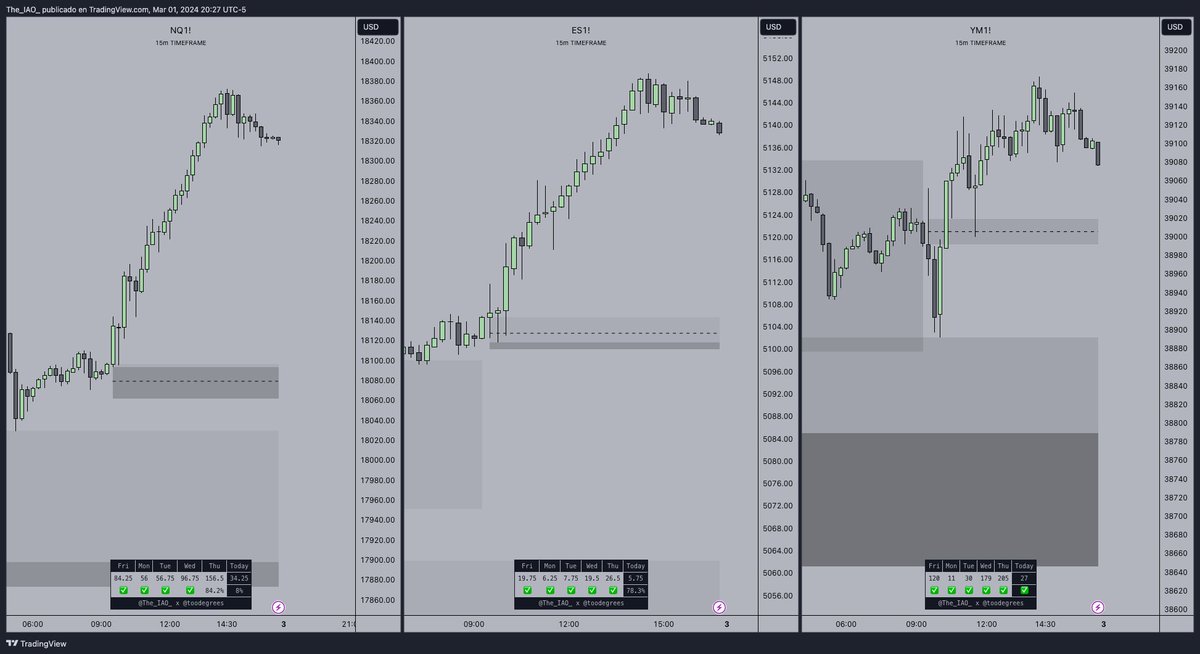
Streamline your RTH Gap Analysis with single chart management, presenting all essential gap data in one place. This provides traders enhanced efficiency and time saved from toggling between session styles.
Toggle and filter to display your gap analysis by Day of the Week. Tailor your templates to specific days with customizable checkboxes for Monday through Friday.

Elevate your market analysis with RTH Gap Visualization.
Our 'Show RTH Gap' function applies customizable color-coding to highlight gap directions, allowing you to set your preferred palette for quick identification of upward and downward gaps, sharpening your chart analysis.
Our 'Show RTH Gap' function applies customizable color-coding to highlight gap directions, allowing you to set your preferred palette for quick identification of upward and downward gaps, sharpening your chart analysis.
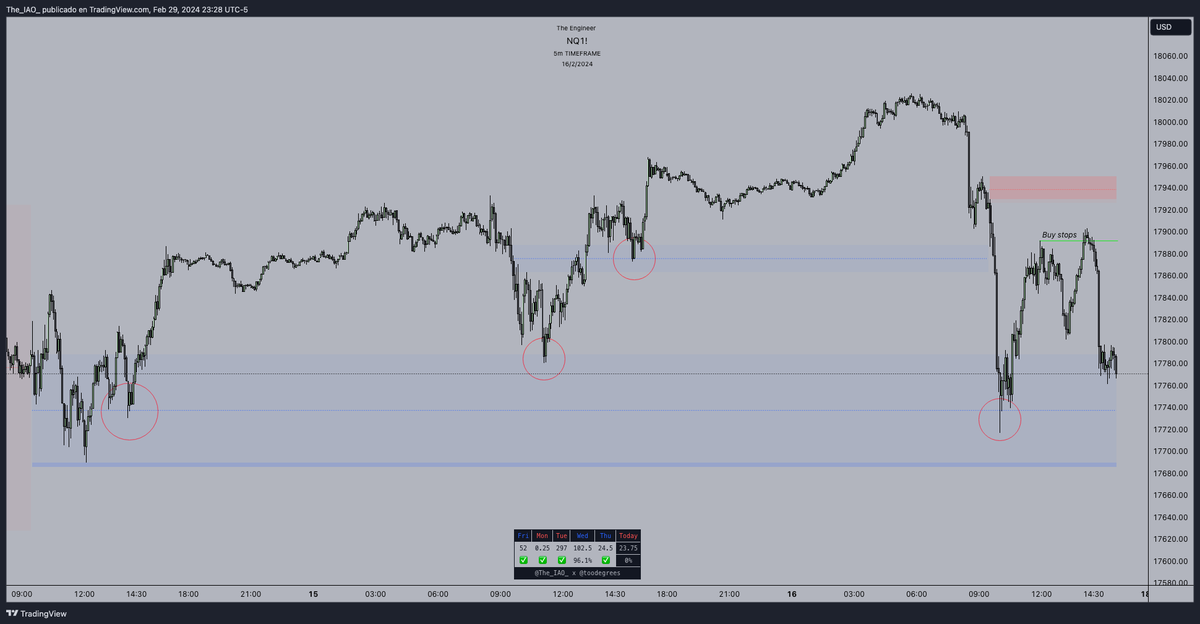
Backtest your Regular Trading Hour Gaps with our Historical CE feature, integrating the concept of Consequent Encroachment (CE) from @I_Am_The_ICT
methodology to pinpoint potential market pivots from gap midpoints.
methodology to pinpoint potential market pivots from gap midpoints.
Enable Gap Grades to monitor deeper insights to larger RTH Gaps, and customize line styles with 'Dashed', 'Solid', or 'Dotted' options.
Activate the 'Show Projections' feature to analyze Standard Deviations of the RTH Gap. Choose between 'Auto' or manual settings to suit your analysis style, enhanced with a selection of visual styles for clear, discernible projection lines on your TV charts.
Gain control over gap projections with the 'Proj. Gap Threshold' slider. This innovative feature adapts to display gaps that align with your backtested values and trading preferences.
Data Table Integration offers a neatly organized compilation of previous gap data, complete with 'Color Coding' for quick visual insights.
Stay informed with Automated Gap and Deviation Alerts! Receive immediate notifications for gap fills or when certain deviation levels are hit, automating part of your trading strategy.
If you've found this thread on the Dynamic RTH Gap Analyzer insightful, I’d love to hear your thoughts. Retweet, bookmark, and share your feedback, along with any updates you would like to see in the future!
Loading suggestions...