

The standard data analyst roadmap is:
Excel
SQL
Visualisation Tool
Optional: Python/R
That's not very helpful.
Here's a detailed breakdown of what you need to learn for each:
Excel
SQL
Visualisation Tool
Optional: Python/R
That's not very helpful.
Here's a detailed breakdown of what you need to learn for each:
Excel 1/4: Data Manipulation and Cleaning
Learn how to handle common data issues such as missing values, duplicates, and inconsistencies.
Focus on filtering, sorting, and conditional formatting.
Also, learn about text functions such as CONCATENATE, LEFT, RIGHT, and MID.
Learn how to handle common data issues such as missing values, duplicates, and inconsistencies.
Focus on filtering, sorting, and conditional formatting.
Also, learn about text functions such as CONCATENATE, LEFT, RIGHT, and MID.
Excel 2/4: Formulas and Functions
Focus on learning key functions such as SUM, AVERAGE, COUNT, COUNTIF, IF, SUMIF, XLOOKUP, or VLOOKUP/INDEX MATCH.
These functions allow you to aggregate data, perform lookups, and make conditional calculations.
Focus on learning key functions such as SUM, AVERAGE, COUNT, COUNTIF, IF, SUMIF, XLOOKUP, or VLOOKUP/INDEX MATCH.
These functions allow you to aggregate data, perform lookups, and make conditional calculations.
Excel 3/4: PivotTables and PivotCharts
Learn how to create pivot tables to quickly generate insights from your data.
Combine them with pivot charts for visual representation.
Knowing how to group, filter, and format pivot tables will enable you to perform complex analysis.
Learn how to create pivot tables to quickly generate insights from your data.
Combine them with pivot charts for visual representation.
Knowing how to group, filter, and format pivot tables will enable you to perform complex analysis.
Excel 4/4: Data Visualisation and Charting
Effective data visualisation is crucial for conveying insights to others.
Learn how to create visually appealing charts using various types, add labels, titles, and data labels, and format them for clarity.
Next up, SQL.
Effective data visualisation is crucial for conveying insights to others.
Learn how to create visually appealing charts using various types, add labels, titles, and data labels, and format them for clarity.
Next up, SQL.
SQL 1/4: Start with the basics
Learn how to write SELECT statements to retrieve data from a single table.
Include:
- Filtering rows using WHERE clauses
- Sorting results using ORDER BY
- controlling the number of returned rows with TOP.
Learn how to write SELECT statements to retrieve data from a single table.
Include:
- Filtering rows using WHERE clauses
- Sorting results using ORDER BY
- controlling the number of returned rows with TOP.
SQL 2/4: Joins
Learn about different types of joins (INNER JOIN, LEFT JOIN, RIGHT JOIN, and FULL JOIN) to combine data based on common columns.
This skill is crucial for pulling insights from relational databases.
Learn about different types of joins (INNER JOIN, LEFT JOIN, RIGHT JOIN, and FULL JOIN) to combine data based on common columns.
This skill is crucial for pulling insights from relational databases.
SQL 3/4: Aggregation and Grouping
Learn to use aggregate functions like COUNT, SUM, AVG, MAX, and MIN.
Implement GROUP BY clauses to group data by specific columns, allowing you to analyse trends and patterns within different subsets of the data.
Learn to use aggregate functions like COUNT, SUM, AVG, MAX, and MIN.
Implement GROUP BY clauses to group data by specific columns, allowing you to analyse trends and patterns within different subsets of the data.
SQL 4/4: CTEs and Window Functions
CTEs allow you to split up more complex queries and perform pre-aggregations/filters before combining.
Window functions calculate across rows in a specified window, calculating running totals, ranking, and moving averages.
CTEs allow you to split up more complex queries and perform pre-aggregations/filters before combining.
Window functions calculate across rows in a specified window, calculating running totals, ranking, and moving averages.
Data Viz 1/4: Storytelling and Context
Develop the ability to understand data deeply and create visualisations that tell a clear, concise story.
Know the purpose of your visualisation and provide context for your audience.
Develop the ability to understand data deeply and create visualisations that tell a clear, concise story.
Know the purpose of your visualisation and provide context for your audience.
Data Viz 2/4: Visualisation Design
Master design principles such as data-ink ratio, effective colour usage, and clarity in labels to create visually appealing and informative visualisations.
Master design principles such as data-ink ratio, effective colour usage, and clarity in labels to create visually appealing and informative visualisations.
Data Viz 3/4: Chart Selection and Techniques
Learn various chart types and techniques for different data types and analysis goals.
Choose the best representation to convey insights accurately.
Learn various chart types and techniques for different data types and analysis goals.
Choose the best representation to convey insights accurately.
Data Viz 4/4: Data Integrity and Accuracy
Ensure data accuracy, perform data cleaning, and handle missing values properly to avoid misleading visualisations.
Ensure data accuracy, perform data cleaning, and handle missing values properly to avoid misleading visualisations.
Finally, our optional step is: Python or R
If you decide to go for it, only one is necessary at this stage.
Your choice will depend on the industry or role you're looking for.
Python is more versatile; R is more specialised for statistical analysis and data visualisation.
If you decide to go for it, only one is necessary at this stage.
Your choice will depend on the industry or role you're looking for.
Python is more versatile; R is more specialised for statistical analysis and data visualisation.
Python/R 1/4: Data Manipulation and Analysis
Master data manipulation libraries like Pandas (Python) or dplyr (R) to efficiently clean, transform, and analyse datasets.
Learn to handle missing data, aggregate information, and perform calculations.
Master data manipulation libraries like Pandas (Python) or dplyr (R) to efficiently clean, transform, and analyse datasets.
Learn to handle missing data, aggregate information, and perform calculations.
Python/R 2/4: Data Visualisation
Develop proficiency in data visualisation libraries like Matplotlib (Python) or ggplot2 (R) to create a wide range of charts, graphs, and plots.
Learn to customise visuals for clarity and impact.
Develop proficiency in data visualisation libraries like Matplotlib (Python) or ggplot2 (R) to create a wide range of charts, graphs, and plots.
Learn to customise visuals for clarity and impact.
Python/R 3/4: Statistical Analysis and Modelling
Gain a strong foundation in statistical concepts and use libraries like SciPy (Python) or Stats (R) to perform hypothesis testing, regression analysis, and other advanced statistical techniques.
Gain a strong foundation in statistical concepts and use libraries like SciPy (Python) or Stats (R) to perform hypothesis testing, regression analysis, and other advanced statistical techniques.
Python/R 4/4: Data Interpretation and Communication
Hone your skills in interpreting analysis results and effectively communicating findings.
Translate complex insights into understandable narratives that can guide decision-making.
Hone your skills in interpreting analysis results and effectively communicating findings.
Translate complex insights into understandable narratives that can guide decision-making.
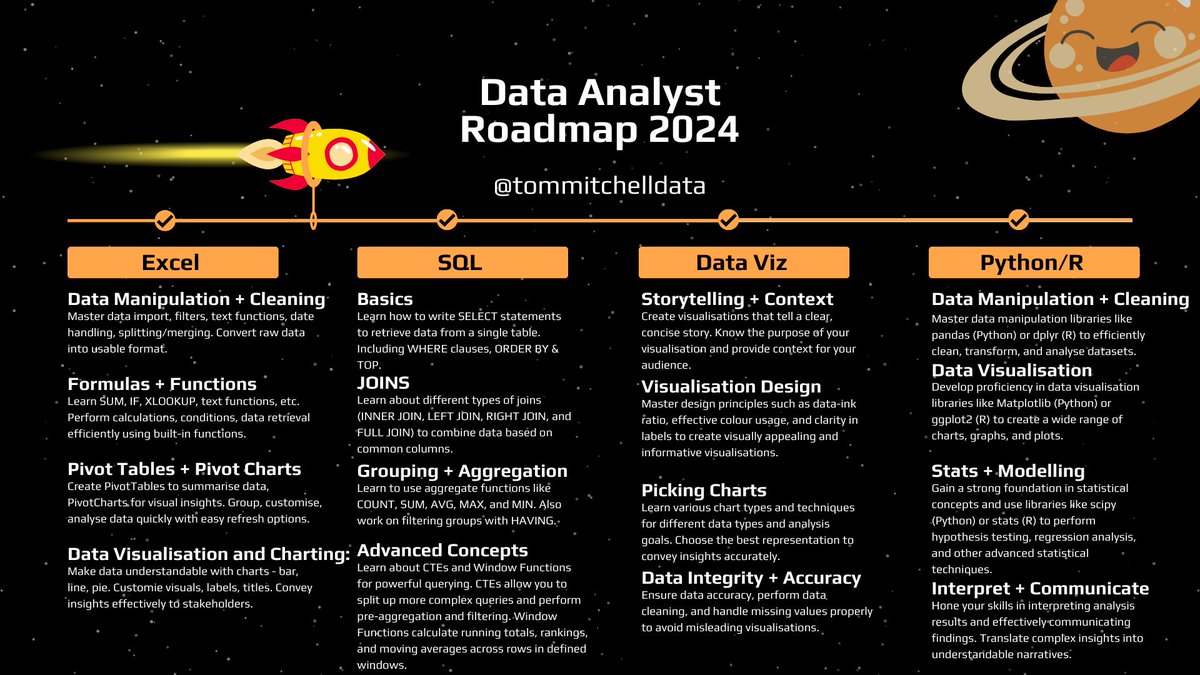
I've pulled all of the above information into a cheat sheet for you to take away:
If you liked this, you'll love my weekly newsletter.
One email, every Saturday, is aimed at helping you get better with data.
Join 9000+ readers for free here: trend-labs.co.uk
One email, every Saturday, is aimed at helping you get better with data.
Join 9000+ readers for free here: trend-labs.co.uk

Loading suggestions...