

A short thread on a top-down approach I use for shortlisting relatively stronger stocks for swing/positional trades using TradePoint software from @Definedge
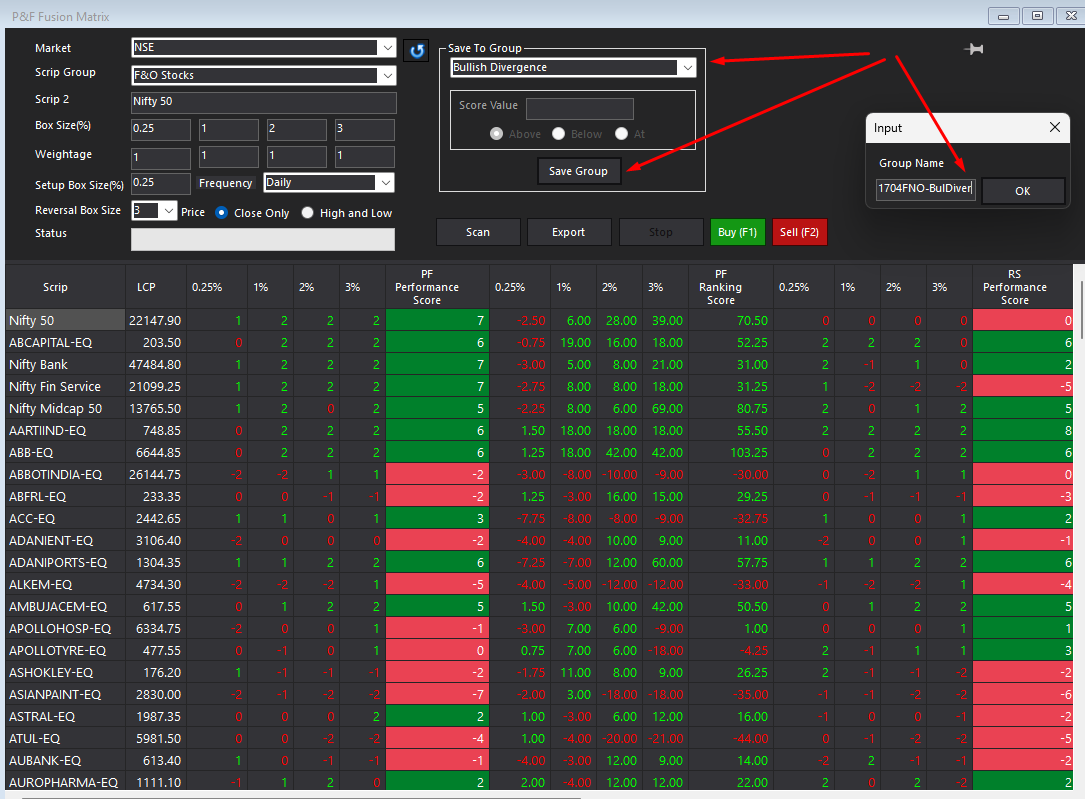
1) Run P&F fusion matrix on F&O Stocks
2) Save it into a group for stocks having bullish divergence in RS charts vis-a-vis price charts
++
1) Run P&F fusion matrix on F&O Stocks
2) Save it into a group for stocks having bullish divergence in RS charts vis-a-vis price charts
++
3) On this group run Fusion matrix again
4) Sort on descending RS Ranking score
++
4) Sort on descending RS Ranking score
++
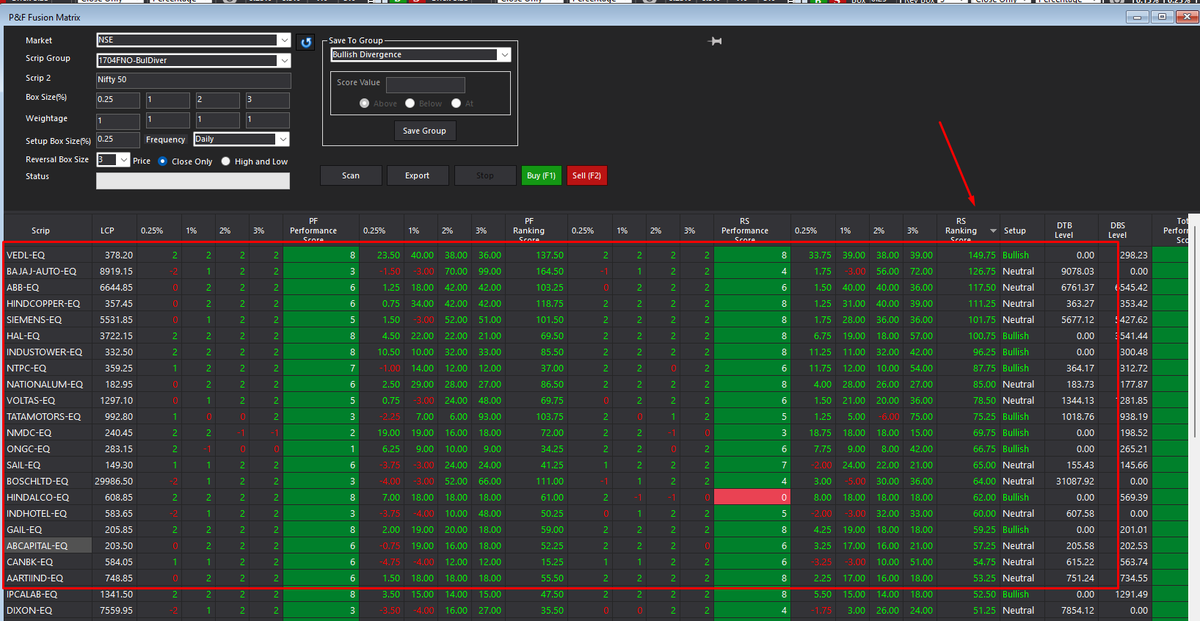
5) Using Chart Scroller feature of TradePoint quickly view the charts of top ranked stocks with a view of affordability of risk. In this example I have added the following stocks for my watch list
a) ABCAPITAL
b) BAJAJ-AUTO
c) NATIONALUM
d) NTPC
e) TATAMOTORS
f) VOLTAS
a) ABCAPITAL
b) BAJAJ-AUTO
c) NATIONALUM
d) NTPC
e) TATAMOTORS
f) VOLTAS
Let us view couple charts -
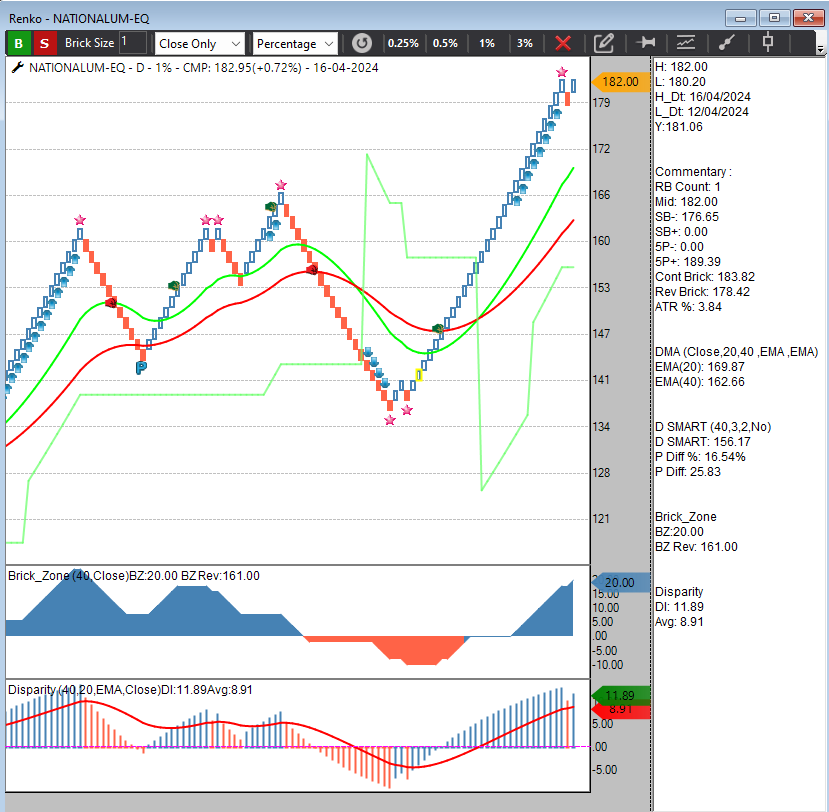
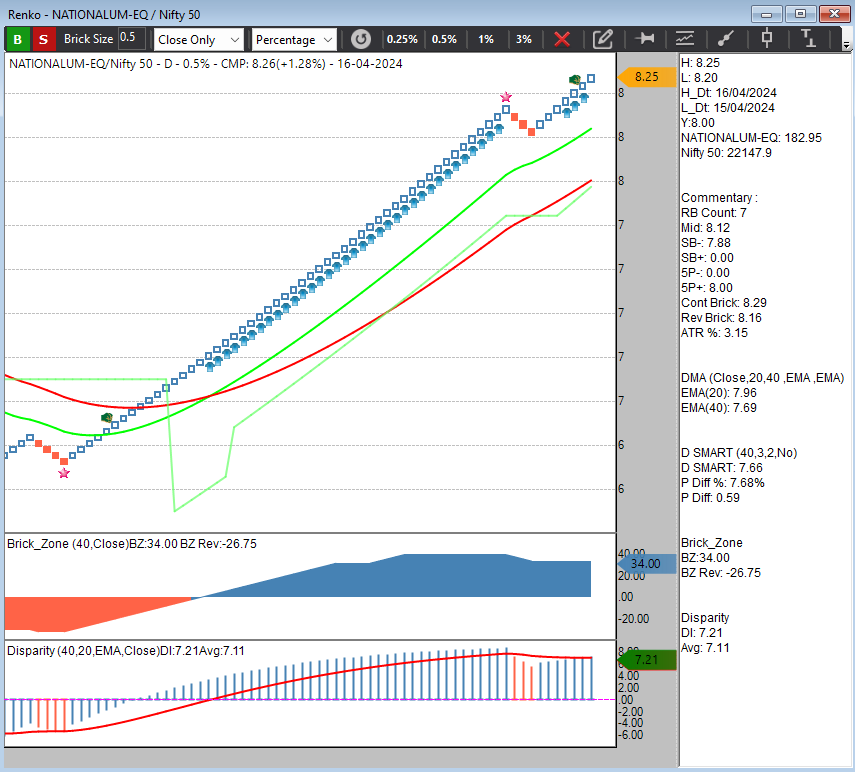
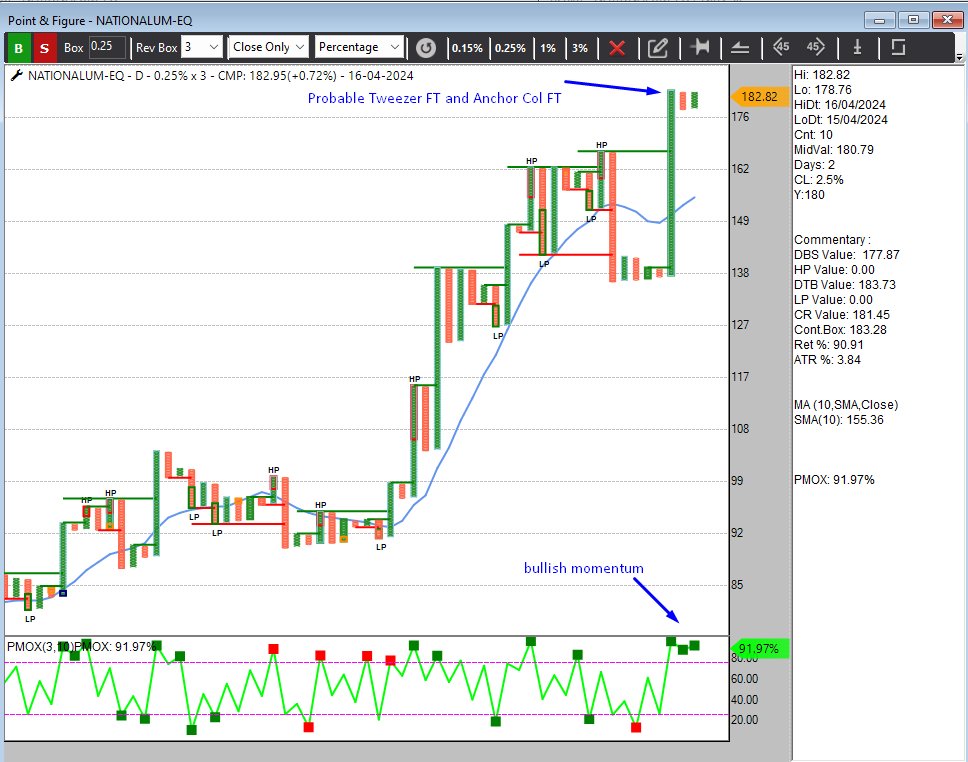
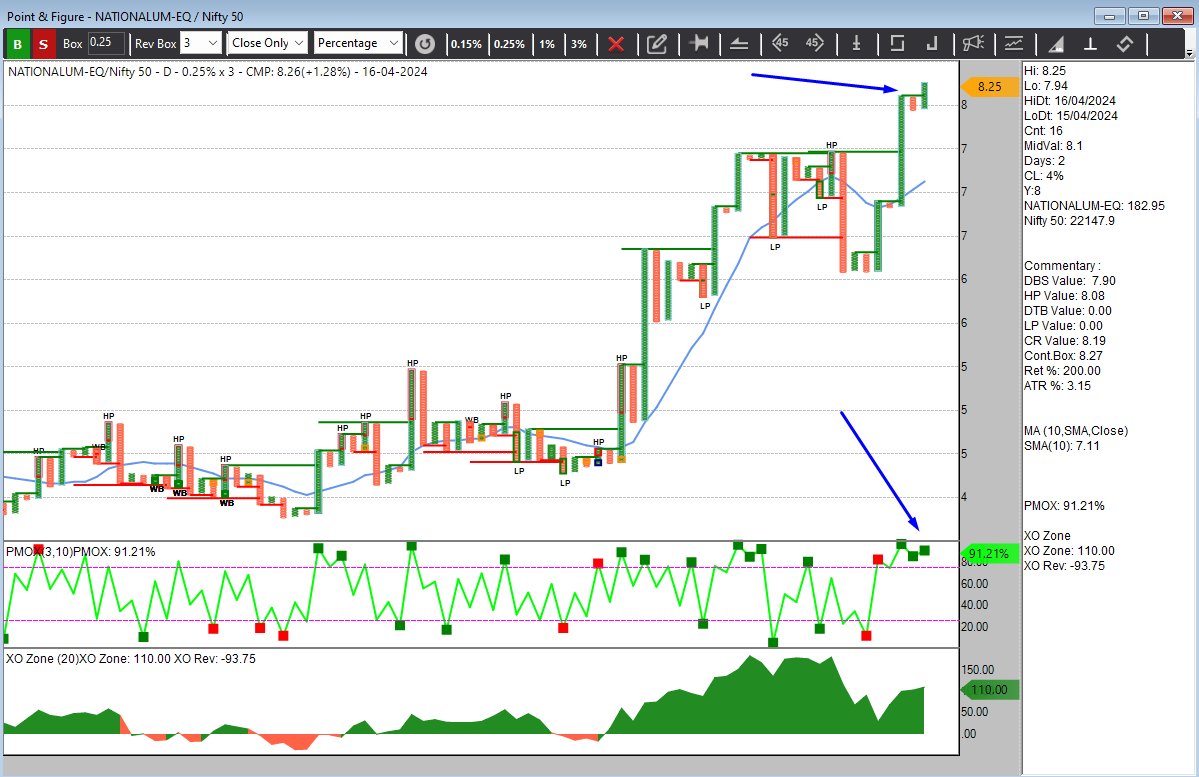
1) NATIONALUM - notice the bullish divergence in RS charts (in RENKO, RS chart has already given swing breakout while price chart is a probable one back bullish pattern. In P&F, RS chart has already given a bullish double top buy while in Price charts it is a probable breakout candidate)
1) NATIONALUM - notice the bullish divergence in RS charts (in RENKO, RS chart has already given swing breakout while price chart is a probable one back bullish pattern. In P&F, RS chart has already given a bullish double top buy while in Price charts it is a probable breakout candidate)
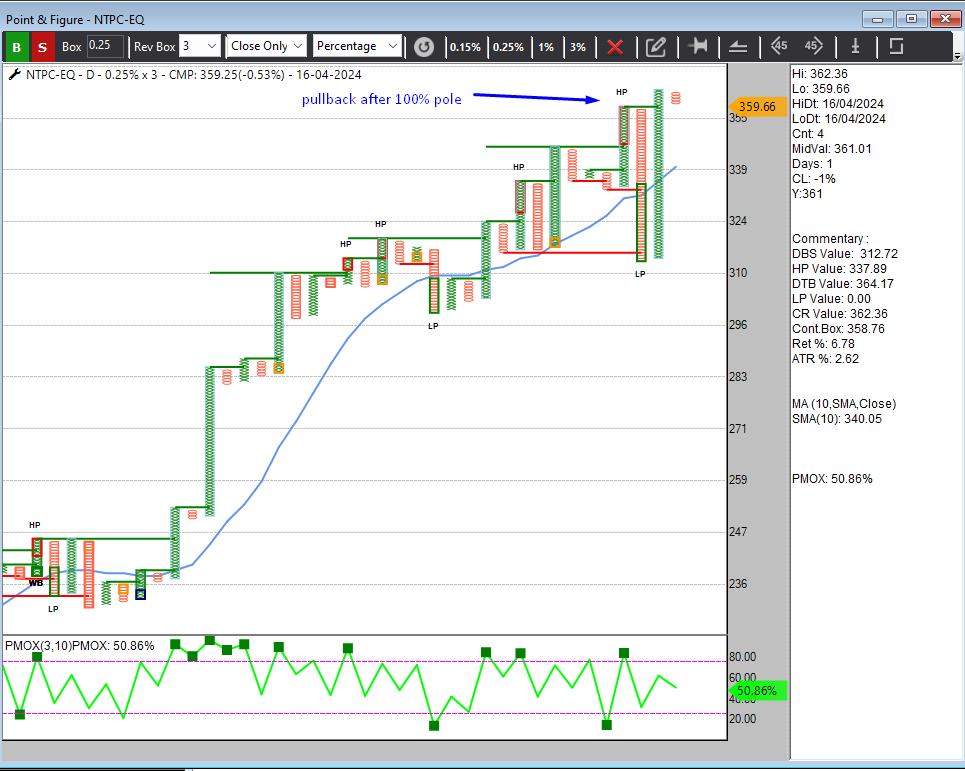
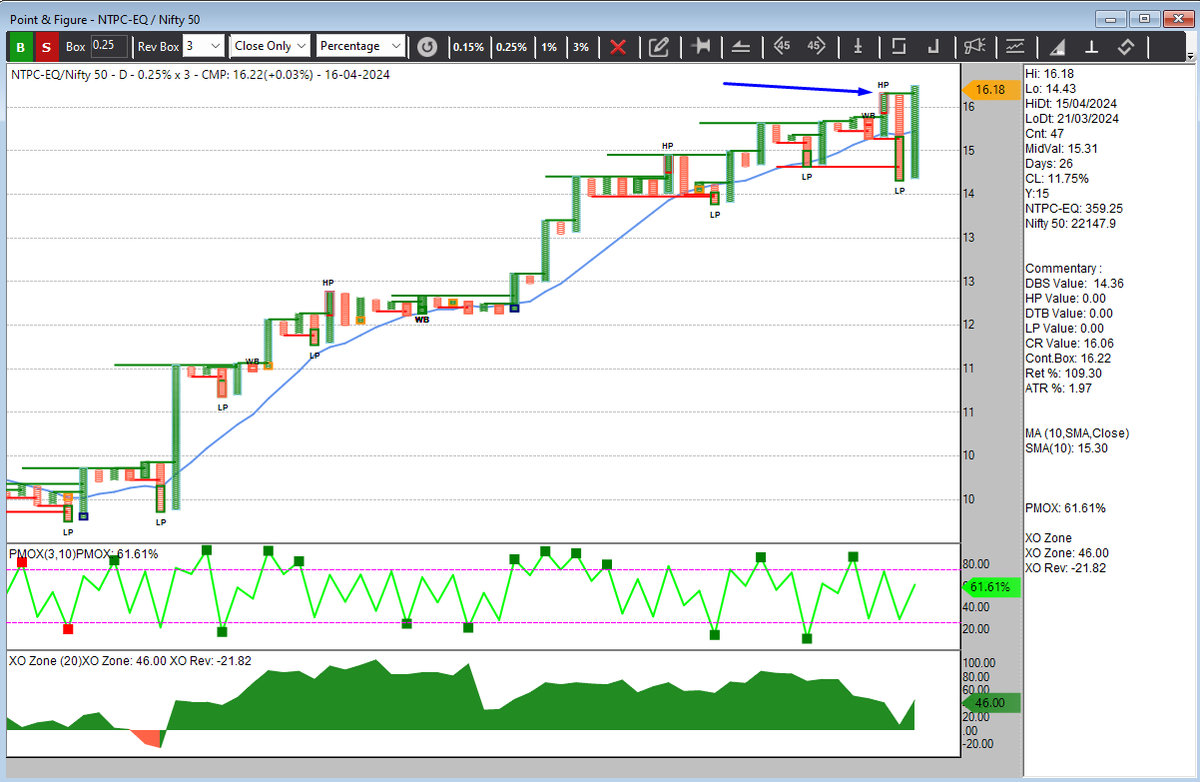
2) NTPC - Notice the divergence in RS and Price charts, a double top buy here is a good opportunity to go long.
3) BAJAJ-AUTO - The screen shown is from chart scroller feature, famously called as TAK-TAK feature by @rajran06 😃😃
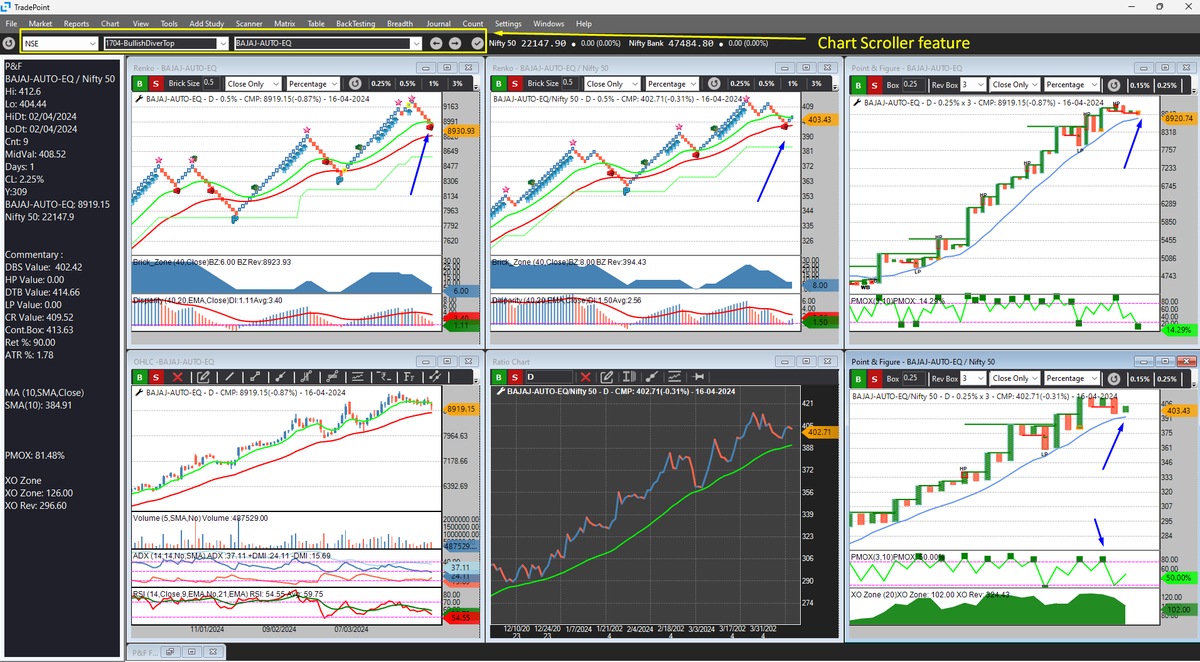
First run is for selecting bullish divergence stocks and second run is to rank the selected stocks based on RS Ranking score. The idea is to reduce the number of stocks from watch list.
Loading suggestions...