

Gun to my head if I had to choose one indicator/tool to be stuck with for the rest of my life it would be:
Volume Profile (VP)
"....and volume ultimately measuring the success or failure of all advertised opportunities."
A Comprehensive Guide on VP - 🧵
Volume Profile (VP)
"....and volume ultimately measuring the success or failure of all advertised opportunities."
A Comprehensive Guide on VP - 🧵
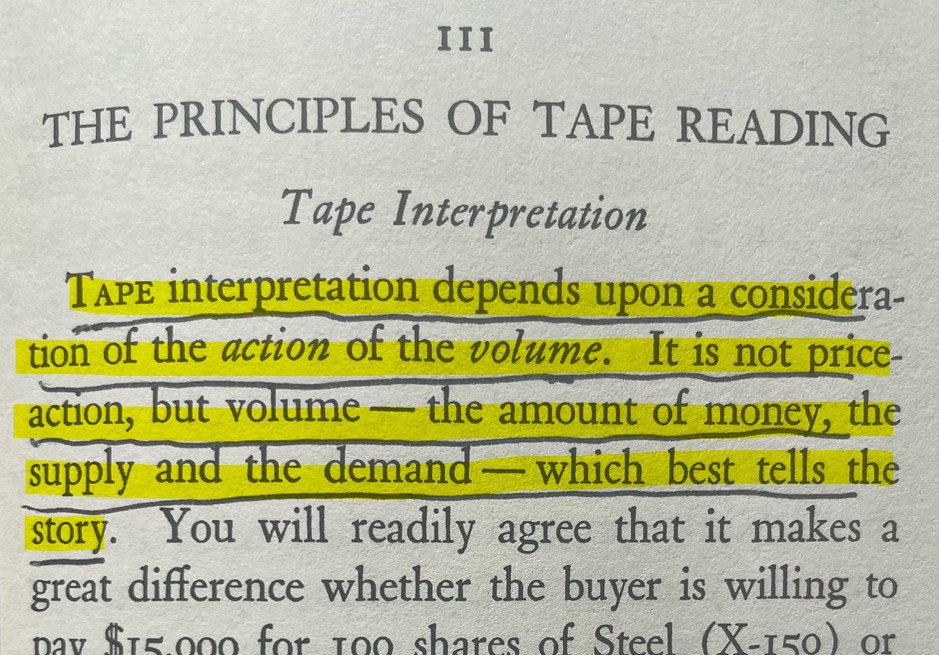
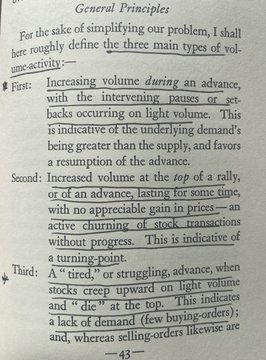
2. The Significance of Volume
"Tape Reading & Market Tactics" by Humphrey B. Neill is a 1931 Wall Street classic.
Price is simply an advertising mechanism with time regulating all advertised opportunities
and volume ultimately measuring the success or failure of all advertised opportunities.
-Jim Dalton
"Tape Reading & Market Tactics" by Humphrey B. Neill is a 1931 Wall Street classic.
Price is simply an advertising mechanism with time regulating all advertised opportunities
and volume ultimately measuring the success or failure of all advertised opportunities.
-Jim Dalton
3. Auction Market Theory & Value
While auction market theory isn't a strategy, it is a framework that allows you to understand the dynamics of how price moves.
In my opinion, this is a crucial framework to understand and should be one of the first things every trader should wrap their head around.
This also leads into how value is established, significant of volume distribution in a range etc.
Here is an old thread I put together on the subject (will probably add and create a new thread on this in the future):
x.com
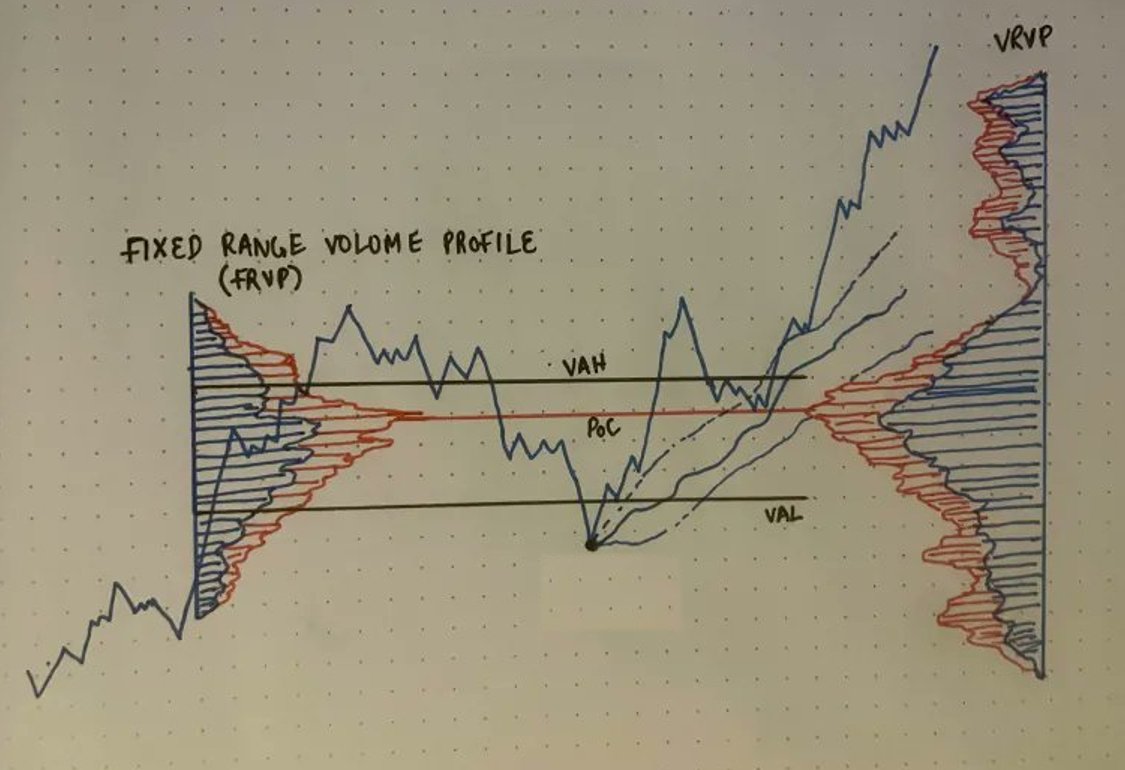
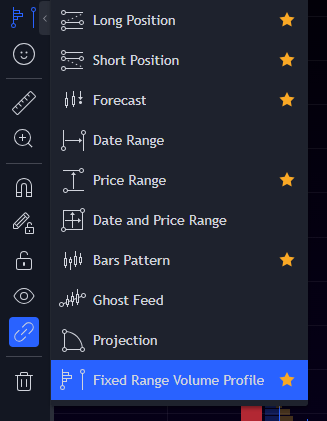
4. Fixed Range Volume Profile (FRVP)
Alright now that we have some background information and a (hopefully) sound foundation, we can talk about the subject at hand.
The FRVP Tool can be found under the "Prediction & Measurement Tools" on the left side of the chart in @TradingView (where the long/short tool is located).
This tool will allow you to define a fixed range for the volume profile based on a specific time period.
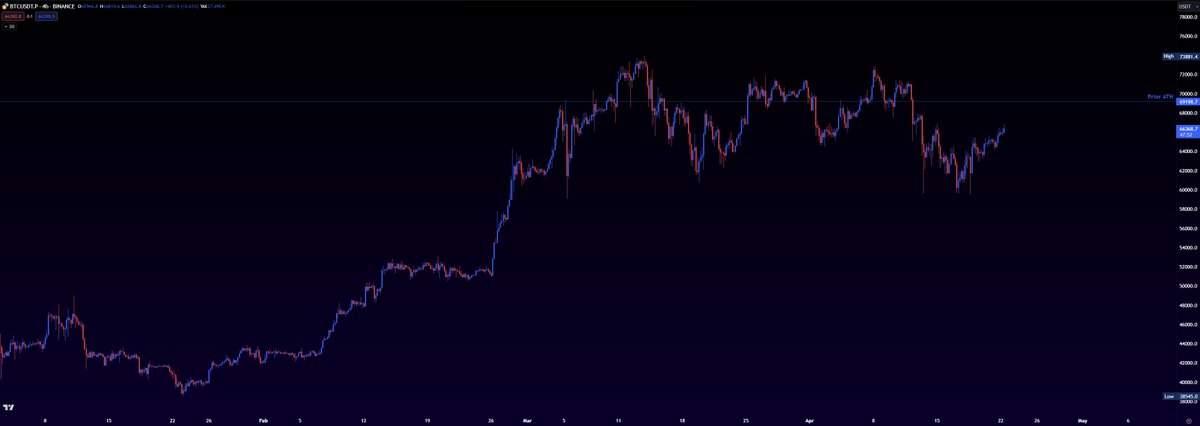
5. Step by Step Walkthrough using $BTC
Let's walk through a current example and use FRVP to determine areas of interest.
Attached is a clean chart of $BTC 4H.
Let's walk through a current example and use FRVP to determine areas of interest.
Attached is a clean chart of $BTC 4H.
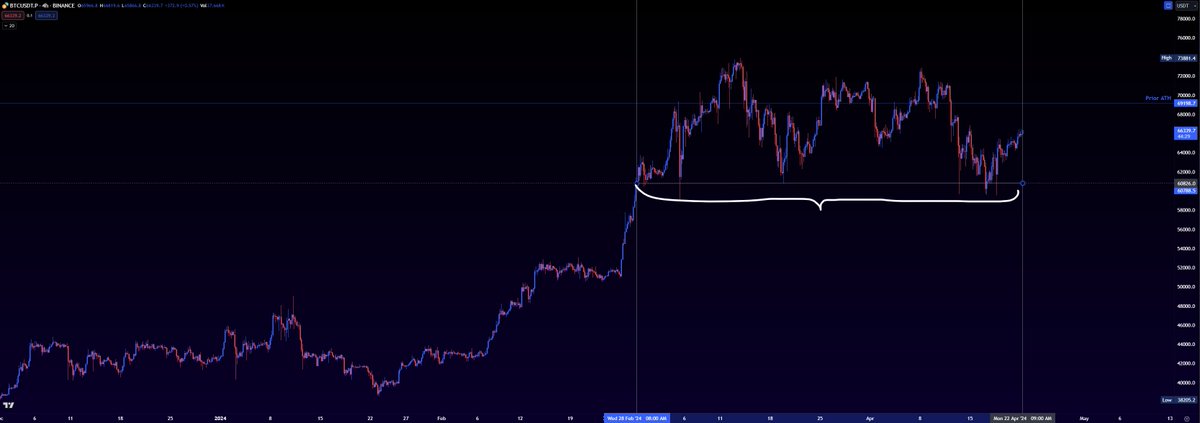
6. Establish a Start-End Point
Once the FRVP tool is selected, it will ask for a start and end point that will be used to calculate a volume profile distribution.
These start and end points are discretionary in nature.
In this case, I am interested in learning more about this obvious range we have been in since ~the end of Feb.
Once the FRVP tool is selected, it will ask for a start and end point that will be used to calculate a volume profile distribution.
These start and end points are discretionary in nature.
In this case, I am interested in learning more about this obvious range we have been in since ~the end of Feb.
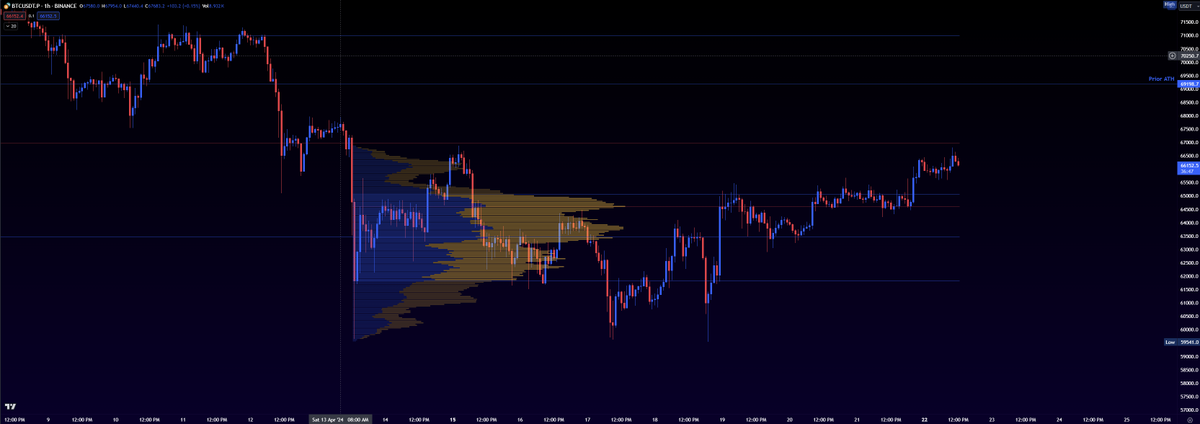
7. Nested FRVPs
Now that we have a volume profile of the larger range, I would also like to point out that if you want more granularity within a range you can also nest another profile.
In this case, I am also interested in the range established on the 1H $BTC chart after the 13th of April.
If you are looking to draw a profile in the middle of the range and don't want it to extend to the end, there is an option under settings that is checked by default: "extend right". You can switch this off.
Image attached for both 4H and 1H.
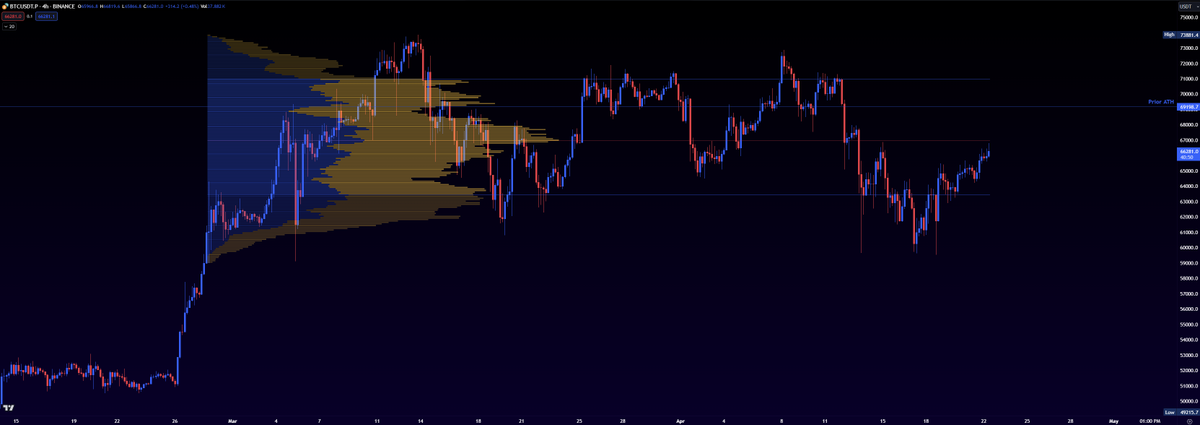
8. The Beauty of FRVP
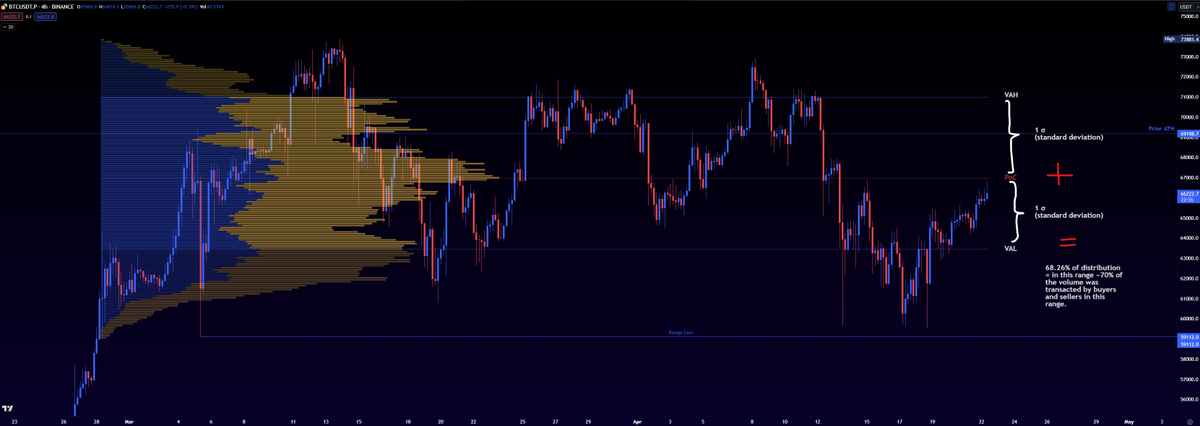
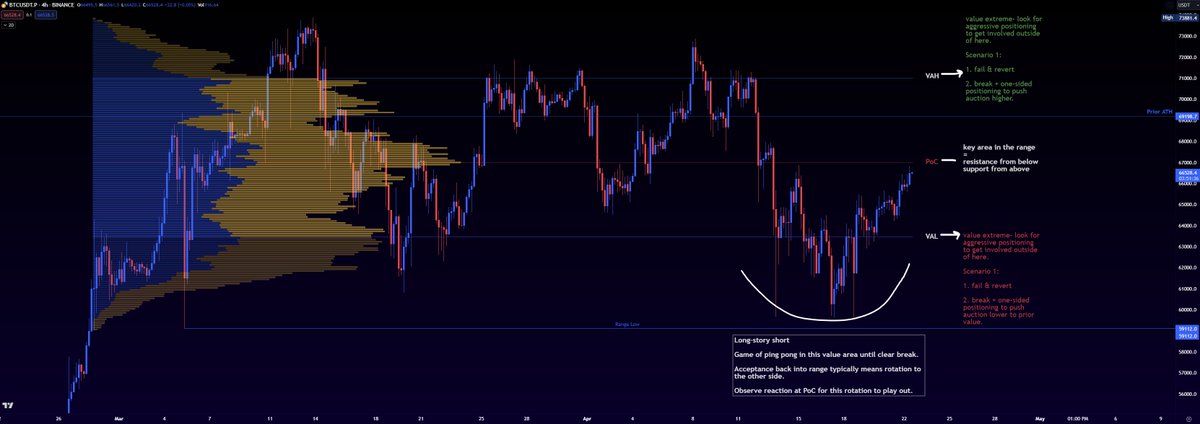
Back to the larger range, let's label the following:
Value Area High (VAH)
Value Area Low (VAL)
Point of Control (PoC)
Here is what we have established from the click of a few buttons:
- we have determined where ~70% of the volume was transacted in a range as well as knowing the extremes of that distribution (VAH, VAL).
- we know that buyers and sellers are both leaning towards agreeing that in this range, the fair value for buying and selling BTC is ~67,000 (point of control).
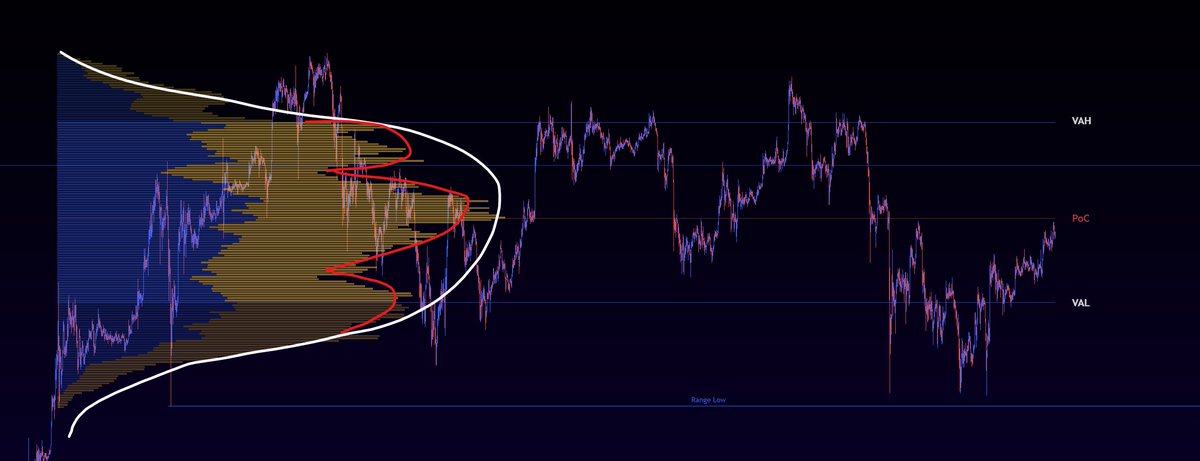
- getting a bit more granular about it, you can also see how "normal" or skewed the distribution is
i.e. in this case, the volume profile is fairly balanced with some local inefficiencies (notches in the distribution, marked in red more relevant for intraday traders and ties into TPO) like a bell curve which means ~ the same amount of volume was transacted above and below the point of control, this has further implications through way of Auction Market Theory.
Back to the larger range, let's label the following:
Value Area High (VAH)
Value Area Low (VAL)
Point of Control (PoC)
Here is what we have established from the click of a few buttons:
- we have determined where ~70% of the volume was transacted in a range as well as knowing the extremes of that distribution (VAH, VAL).
- we know that buyers and sellers are both leaning towards agreeing that in this range, the fair value for buying and selling BTC is ~67,000 (point of control).
- getting a bit more granular about it, you can also see how "normal" or skewed the distribution is
i.e. in this case, the volume profile is fairly balanced with some local inefficiencies (notches in the distribution, marked in red more relevant for intraday traders and ties into TPO) like a bell curve which means ~ the same amount of volume was transacted above and below the point of control, this has further implications through way of Auction Market Theory.
9. Back to Auction Market Theory
Quick detour,
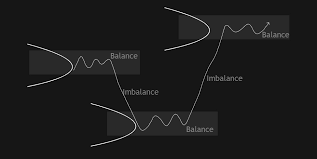
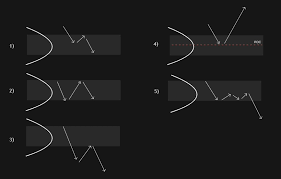
AMT characterizes the markets as cycling b/w two modes:
Balance (Ranging Market)- Indicating indecision
Imbalance (Trending Market) - Aggressive Conviction
When a market is "balanced" it means buyers and sellers are uncertain on where to next so they will establish a range in which to do business. We call this chop.
Images taken from @abetrade's: tradingriot.com
Quick detour,
AMT characterizes the markets as cycling b/w two modes:
Balance (Ranging Market)- Indicating indecision
Imbalance (Trending Market) - Aggressive Conviction
When a market is "balanced" it means buyers and sellers are uncertain on where to next so they will establish a range in which to do business. We call this chop.
Images taken from @abetrade's: tradingriot.com
10. Painting the Picture & Completing it this time
Armed with all the information we have just learned.
Here are some potential takeaways from using the FRVP tool for this range (in image).
Showing this as a framework to indicate what kind of thought process can be used.
Also :
x.com
Armed with all the information we have just learned.
Here are some potential takeaways from using the FRVP tool for this range (in image).
Showing this as a framework to indicate what kind of thought process can be used.
Also :
x.com
11. Visible Range Volume Profile (VRVP)
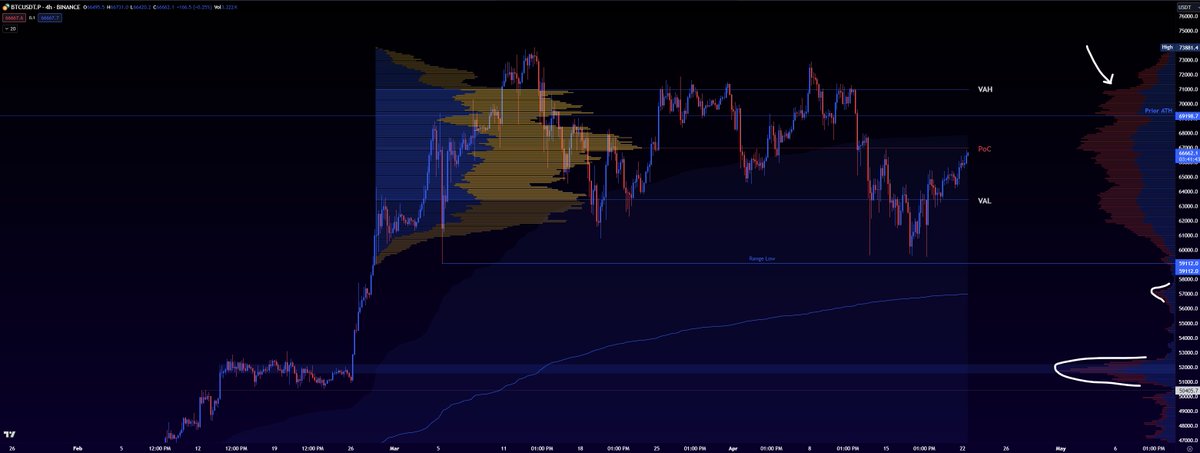
For the sake of completeness, a tool that is on by default on TradingView is the Visible Range Volume Profile (VRVP).
Same idea, the difference is just as the name suggests the profile will be visible for the range that is on the screen.
Both FRVP and VRVP can be used in conjunction (see image)
Here is a quick breakdown of how to use VRVP:
x.com
12. Bonus: Shitcoining
You might be surprised to read this but the principle of using the point of control works relatively well on dexscreener coins as well.
This isn't because people are actively pulling profiles on the chart.
It's because the point of control is where people who are under water will have an itch to dump their coins because they are breaking even and vice versa if approaching from the top.
Some discussion on this here:
x.com
13. In conclusion,
Volume Profiles are a phenomenal tool when combined with price action and an understanding of the dynamics of how value is established, ranging and trending environments, AMT scenarios etc.
Easy to use, intuitive & provide structure.
Volume Profiles are a phenomenal tool when combined with price action and an understanding of the dynamics of how value is established, ranging and trending environments, AMT scenarios etc.
Easy to use, intuitive & provide structure.
If you found this thread to be helpful, please show your support by liking and sharing.
Part 3 and the last part of the series to follow in the future.
Follow for more content like this.
Greatly appreciate the support.
Part 3 and the last part of the series to follow in the future.
Follow for more content like this.
Greatly appreciate the support.

bros?
???
Loading suggestions...