

Delta - A Complete Guide
This will be my complete guide to understanding delta, whilst also covering its use cases for myself in my day to day trading.
a detailed thread 🧵
This will be my complete guide to understanding delta, whilst also covering its use cases for myself in my day to day trading.
a detailed thread 🧵
1. Overview of delta
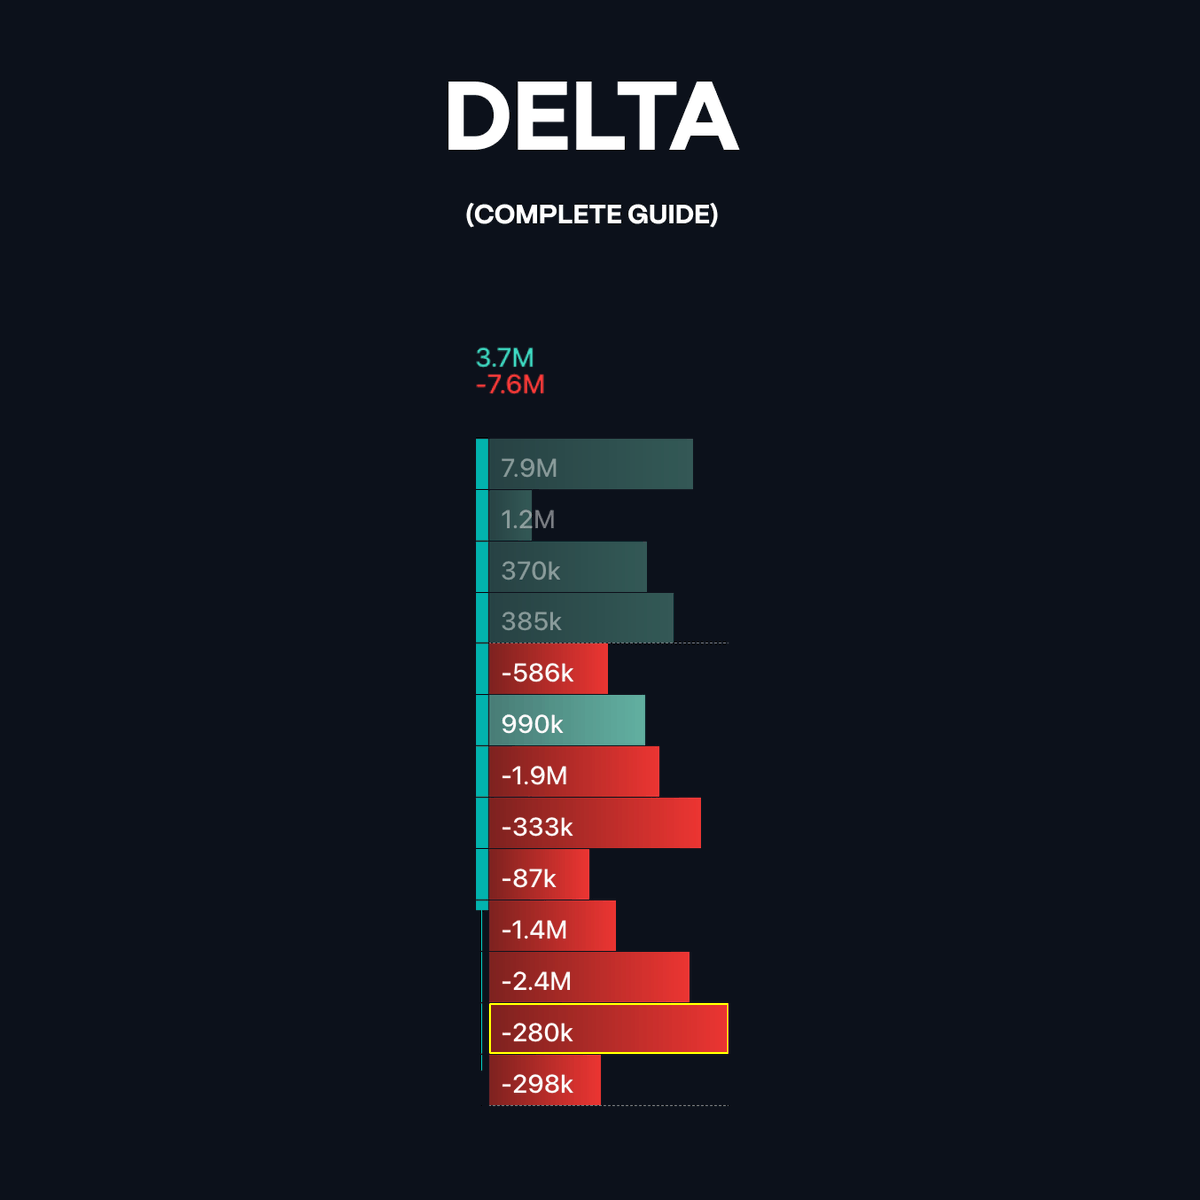
"delta" is the value of difference between 2 things.
In the case of trading and particular footprint charts, delta is the difference between market buys and sells.
If there was $10m market buys vs $3m market sells, that would equal a delta value of +$7m.
"delta" is the value of difference between 2 things.
In the case of trading and particular footprint charts, delta is the difference between market buys and sells.
If there was $10m market buys vs $3m market sells, that would equal a delta value of +$7m.
2. Delta in the Footprint
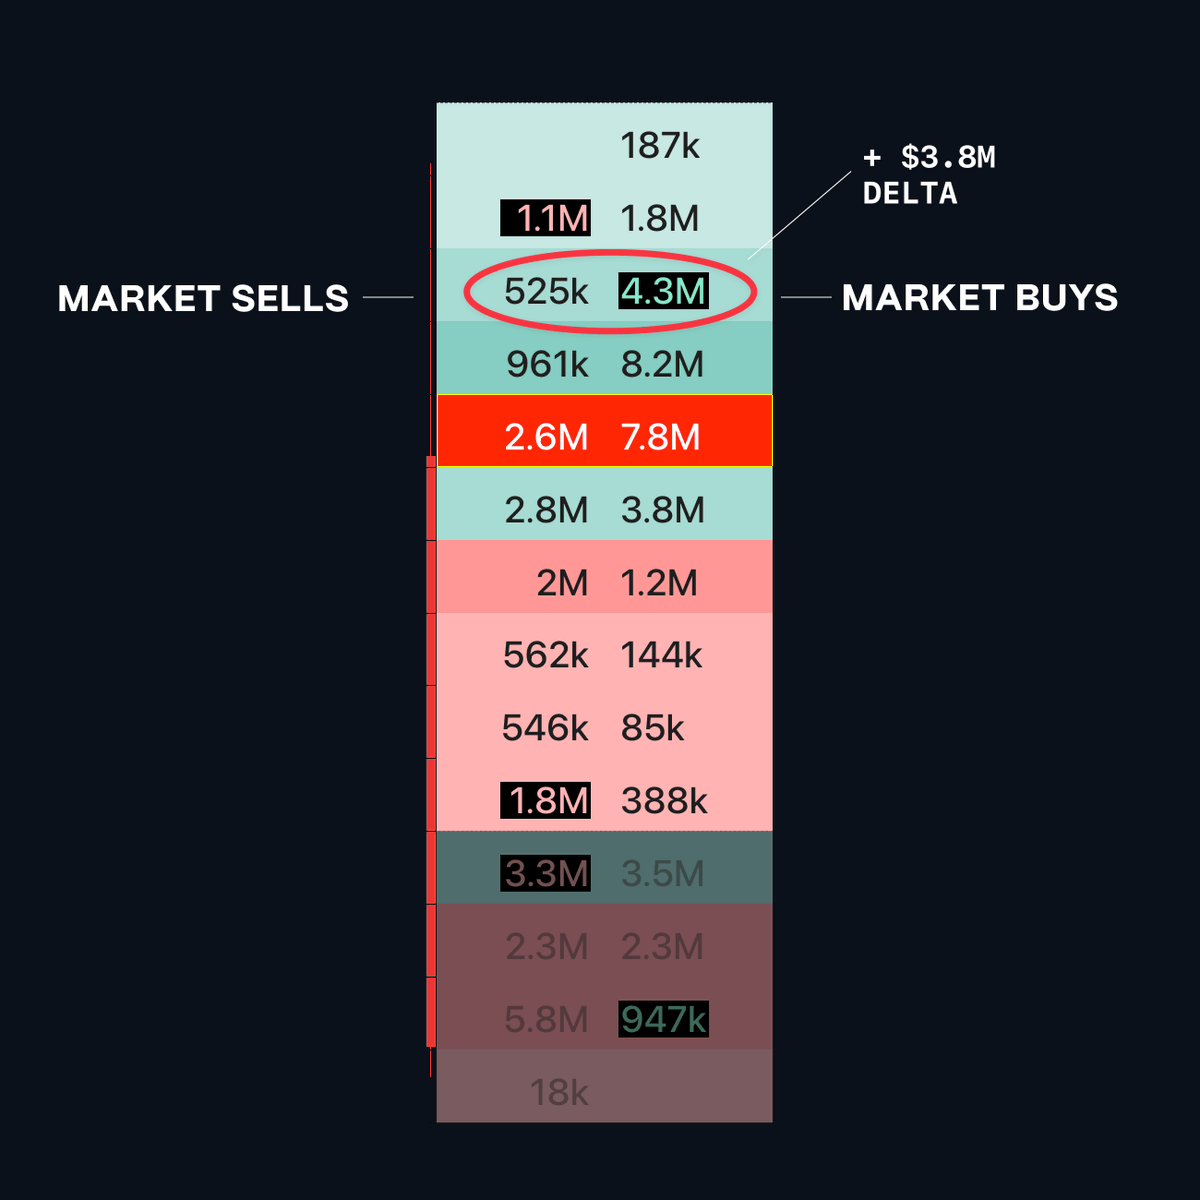
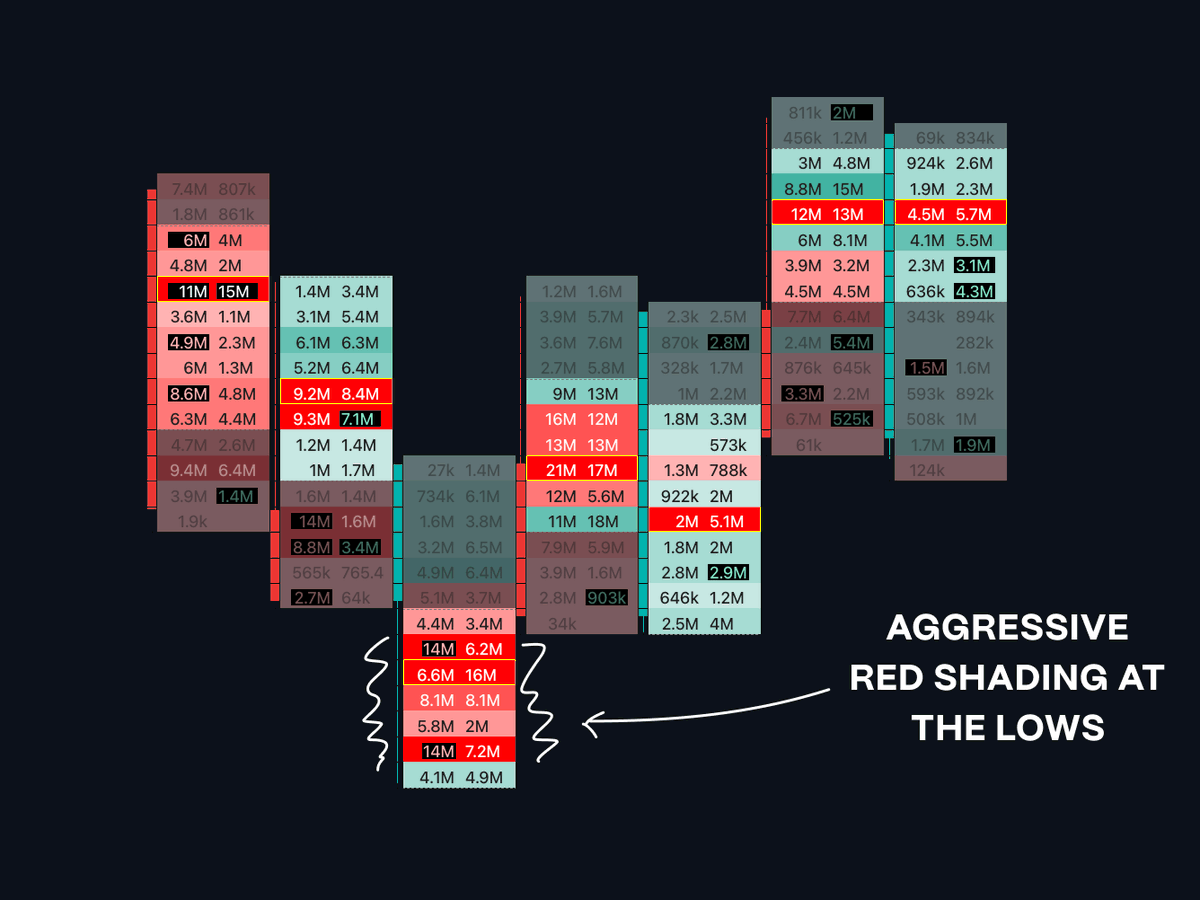
Is used to decipher aggressiveness on one side of the market vs the other.
Not only through delta values, but also through cluster shadings as it is easier to spot aggressiveness through various visual clusters that are shaded than the text values.
Is used to decipher aggressiveness on one side of the market vs the other.
Not only through delta values, but also through cluster shadings as it is easier to spot aggressiveness through various visual clusters that are shaded than the text values.
3. Footprint Delta Explained
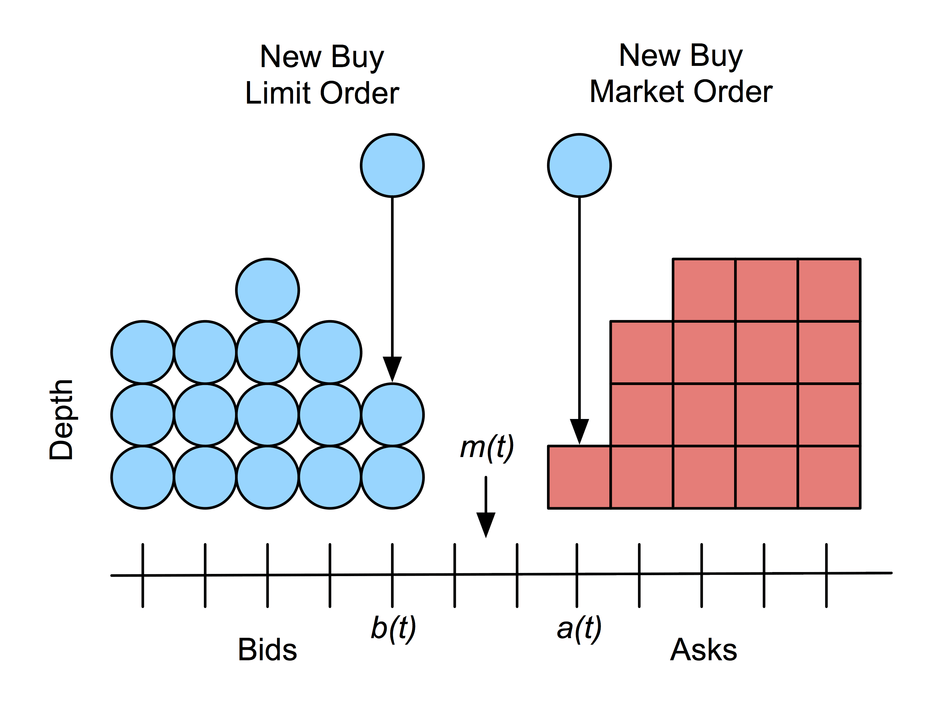
Delta you are seeing within the footprint is strictly market orders. Those orders have to be matched on the opposite side by limit orders, as it's a two-way market.
Aggressive negative delta, would be showing bulk limit buys being passively filled.
Delta you are seeing within the footprint is strictly market orders. Those orders have to be matched on the opposite side by limit orders, as it's a two-way market.
Aggressive negative delta, would be showing bulk limit buys being passively filled.
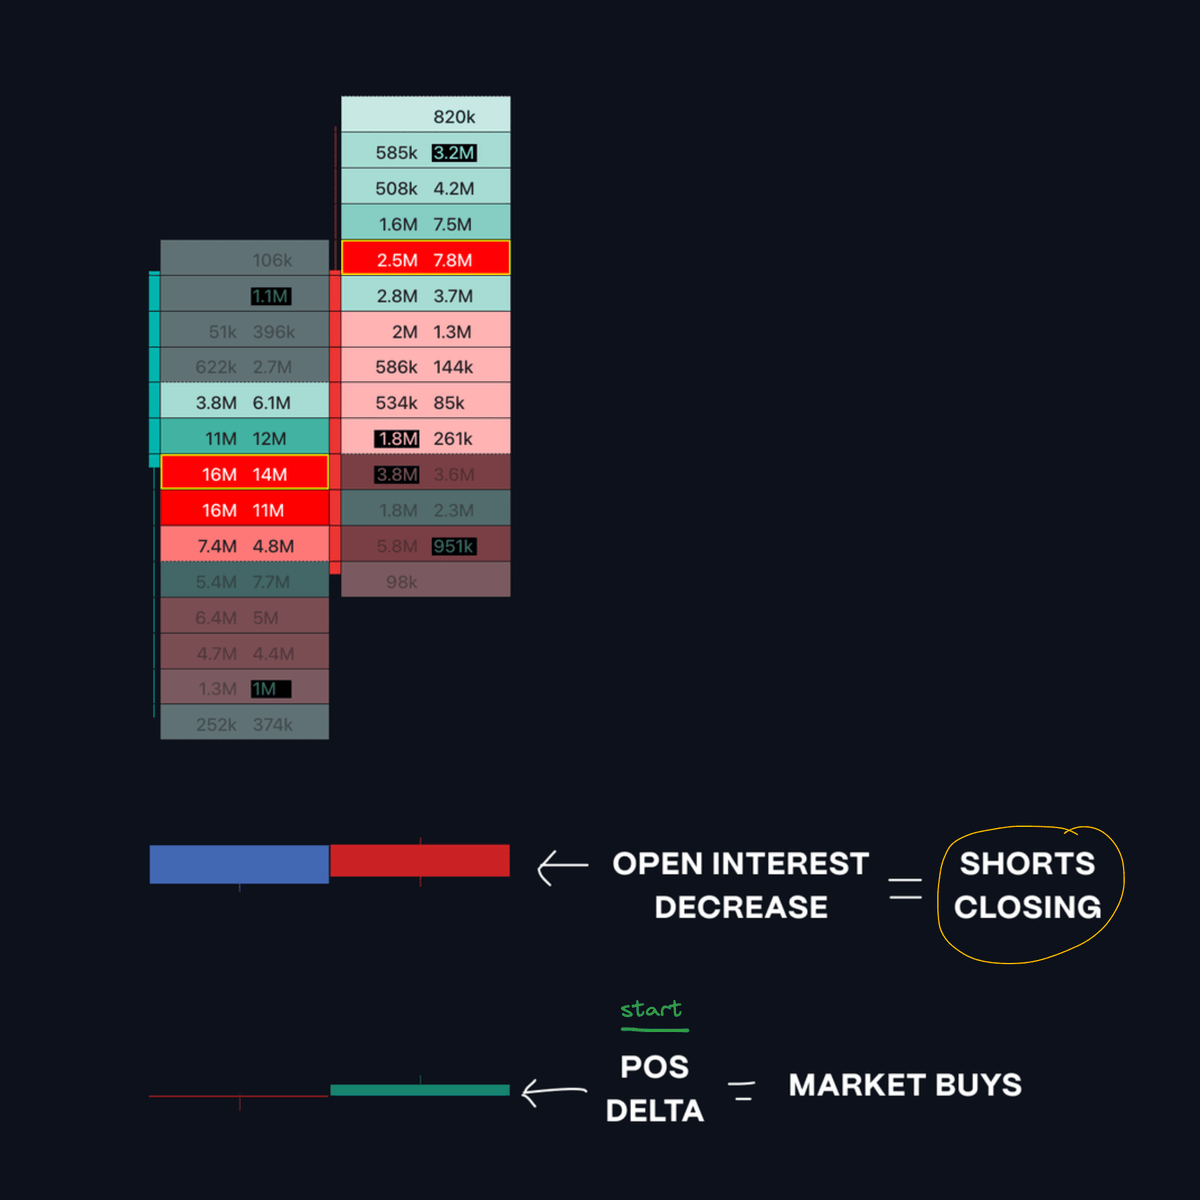
4. Delta with Open Interest
Delta, does NOT tell you whether market sells or market buys you are seeing coming in are new positions.
Shorts closing & new longs opening are BOTH "market buys", delta would still portray these the same...
Delta, does NOT tell you whether market sells or market buys you are seeing coming in are new positions.
Shorts closing & new longs opening are BOTH "market buys", delta would still portray these the same...
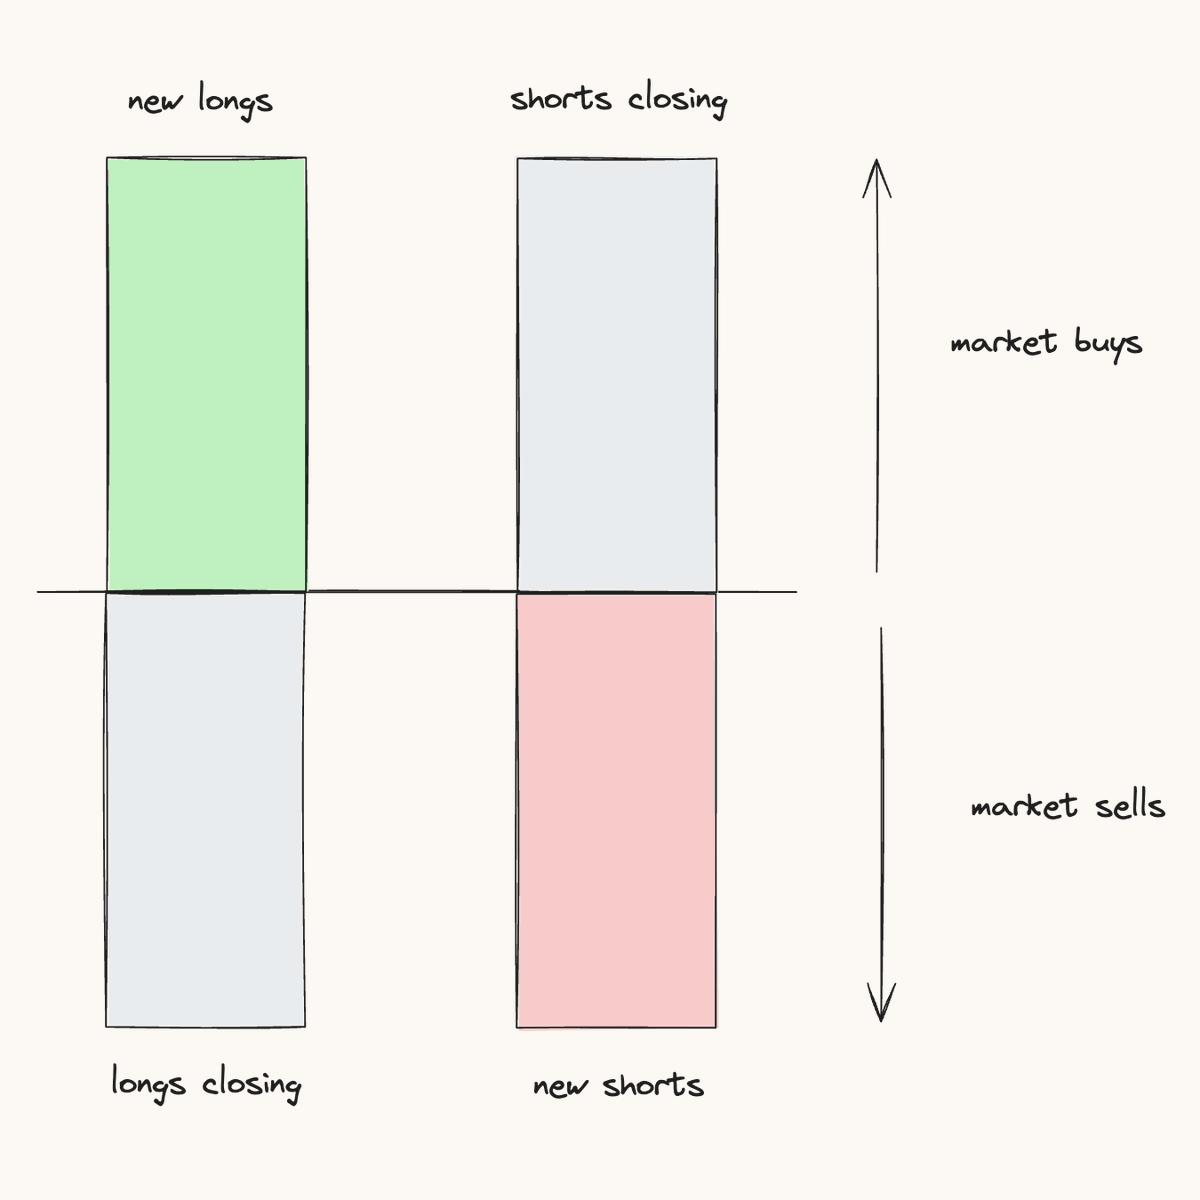
When looking at delta with OI, you are looking at what the majority are doing within that specific zone.
If OI is positive and you have an aggressive positive delta, it is likely that you are looking at those market buys being mostly new longs opening rather than shorts closing.
If OI is positive and you have an aggressive positive delta, it is likely that you are looking at those market buys being mostly new longs opening rather than shorts closing.
5. Delta for Execution
Aggression of delta can be useful in identifying a strong sided market at any POI.
Upon a run of lows being taken, aggressive negative delta will not only identify potential new shorts, but categorically inform you that larger bids are being filled.
Aggression of delta can be useful in identifying a strong sided market at any POI.
Upon a run of lows being taken, aggressive negative delta will not only identify potential new shorts, but categorically inform you that larger bids are being filled.
... You can identify where large orders are being placed via a heatmap, however those orders can be pulled at any given moment.
Delta & volume will instantly be able to show you when aggressive orders are being matched and filled in the books.
Delta & volume will instantly be able to show you when aggressive orders are being matched and filled in the books.
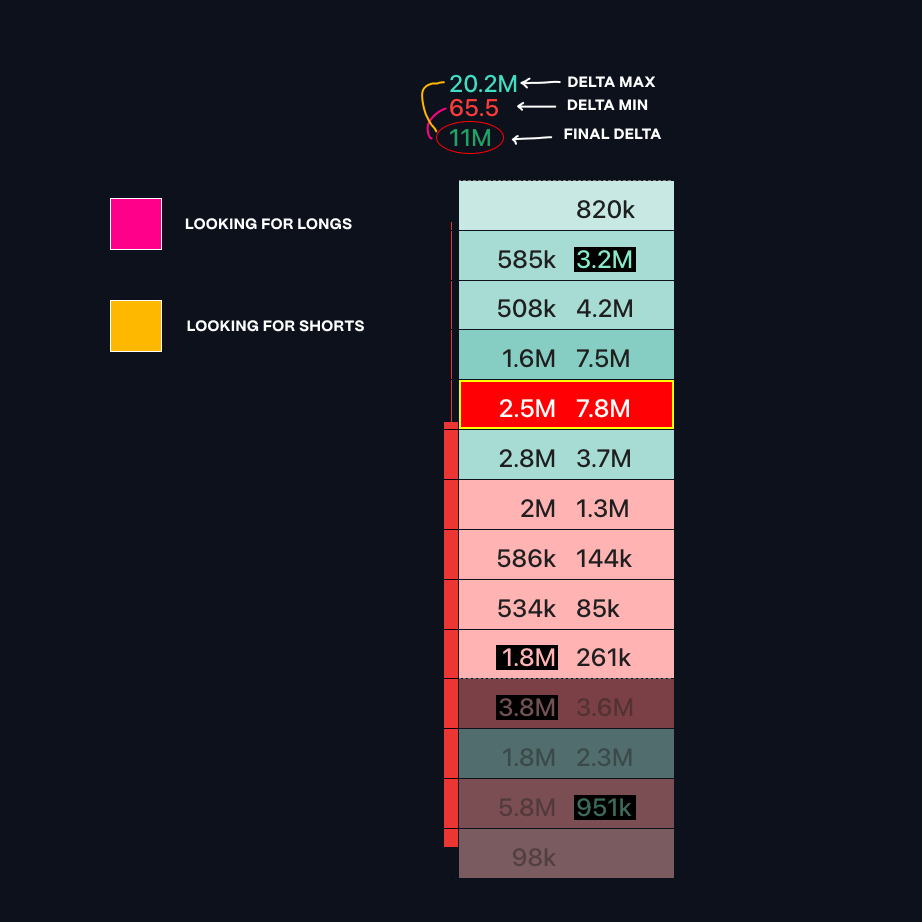
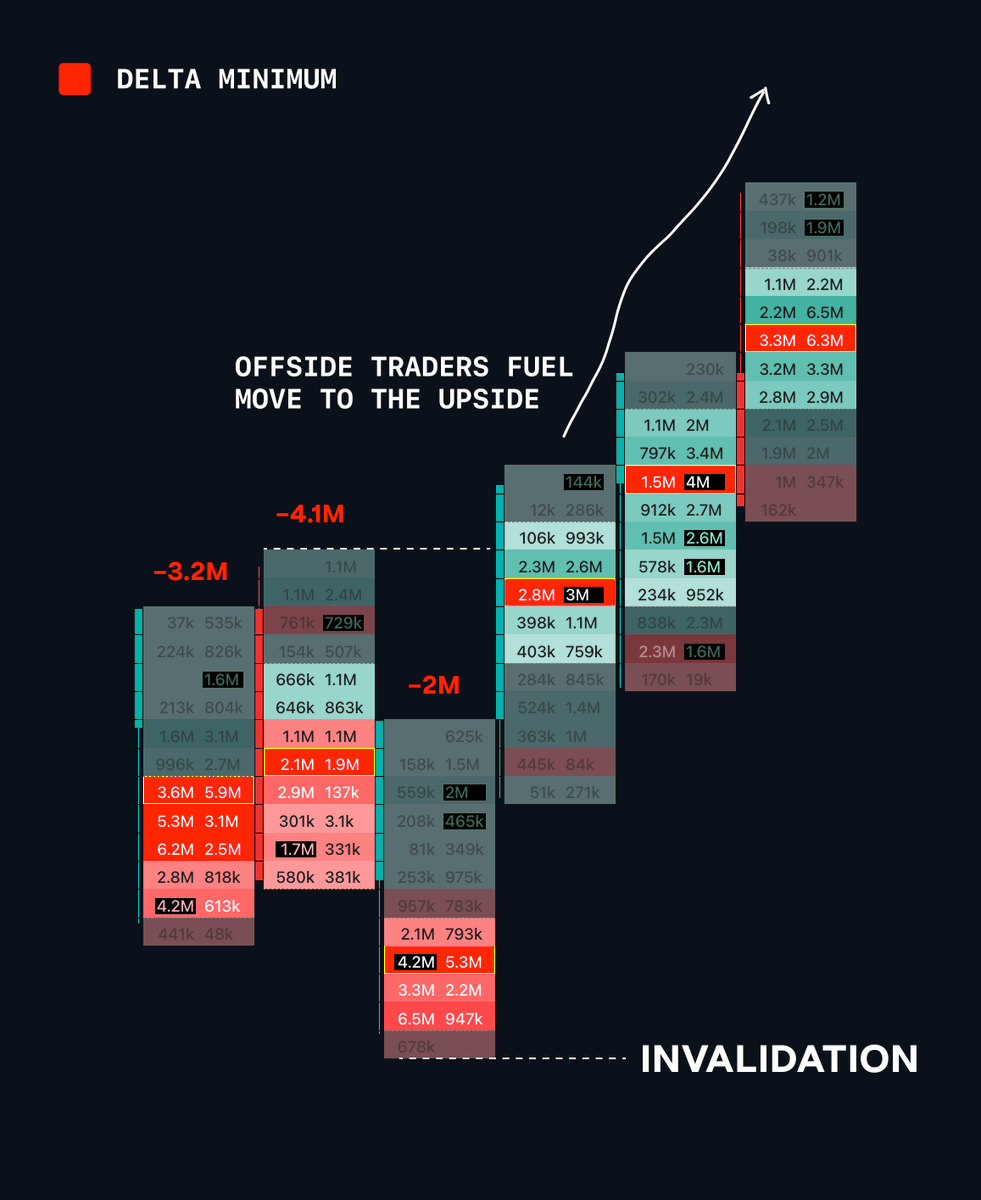
6. Delta max & min
When you are seeing the delta value, you are mainly seeing the final delta value; what the delta ends on upon candle close.
delta maximum and minimum values are can be found within the fpbs or above the candle to show potential swings in delta.
When you are seeing the delta value, you are mainly seeing the final delta value; what the delta ends on upon candle close.
delta maximum and minimum values are can be found within the fpbs or above the candle to show potential swings in delta.
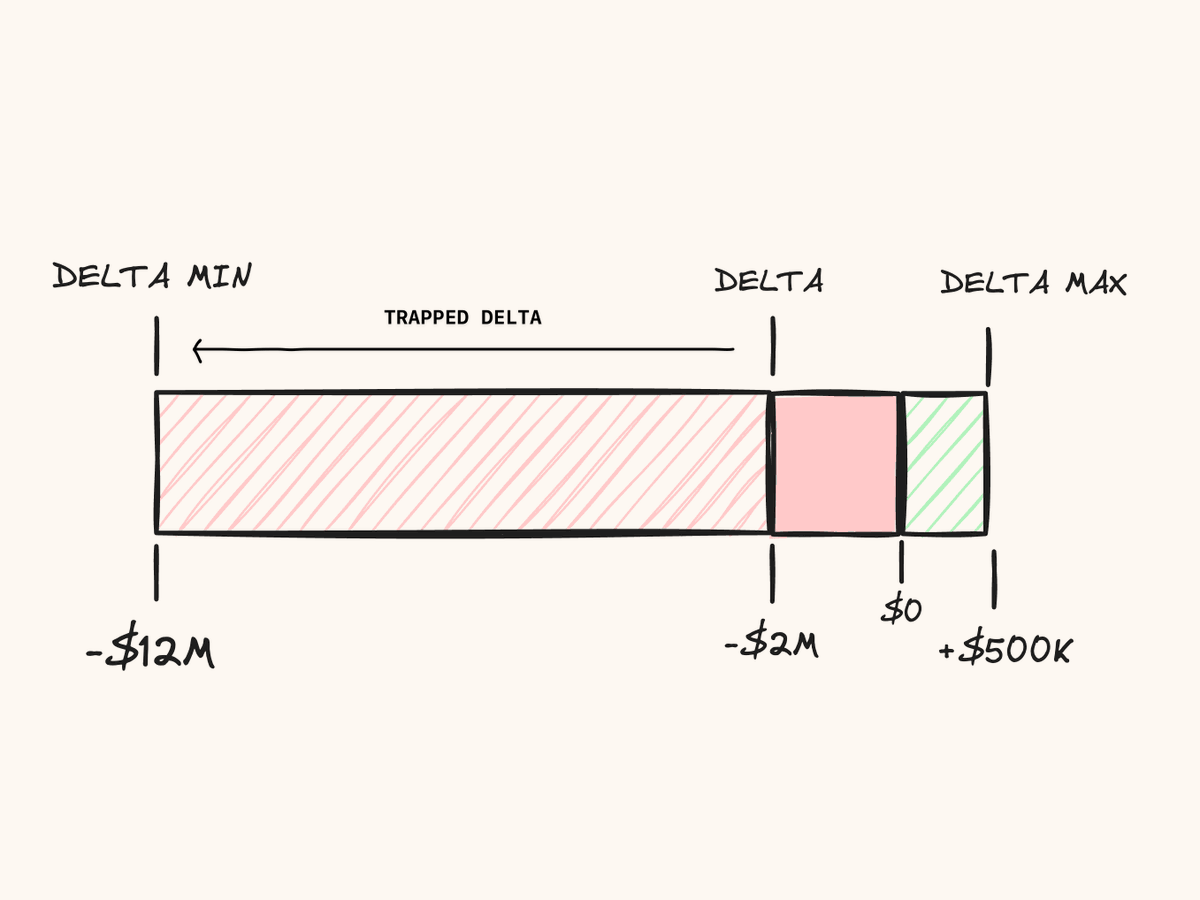
7. Delta swings
If looking for reversal at the lows, I look for a swing between delta and delta minimum.
eg. delta min equals -$12m with the final delta closing at -$2m, leaving -$10m trapped delta.
This also applies to shorts, seeking swings between final delta and delta max.
If looking for reversal at the lows, I look for a swing between delta and delta minimum.
eg. delta min equals -$12m with the final delta closing at -$2m, leaving -$10m trapped delta.
This also applies to shorts, seeking swings between final delta and delta max.
8. Trapped Delta
For trapped delta execution, observe negative (lows) or positive (highs) max/min in a pivot.
My preference is range charts; look for a move away from trapped delta to trade in the opposite direction, as you are then trading with the fuel of the trapped delta.
For trapped delta execution, observe negative (lows) or positive (highs) max/min in a pivot.
My preference is range charts; look for a move away from trapped delta to trade in the opposite direction, as you are then trading with the fuel of the trapped delta.
likes are always appreciated, hopefully you found something valuable.
If you want the following for free check out my accounts pinned post.
- exocharts course
- free month of exocharts
- free CMM (automated journal)
- daily report card template
If you want the following for free check out my accounts pinned post.
- exocharts course
- free month of exocharts
- free CMM (automated journal)
- daily report card template

Loading suggestions...