

Hell Week Tutorial 6 - Volume Profile In Trading🧵
This is part 2 of a complete guide to:
1. Understand what is volume
2. Why is it important
3. Volume Profile Tools
4. How to use it to Trade Live
Part 1 - bit.ly
This is part 2 of a complete guide to:
1. Understand what is volume
2. Why is it important
3. Volume Profile Tools
4. How to use it to Trade Live
Part 1 - bit.ly
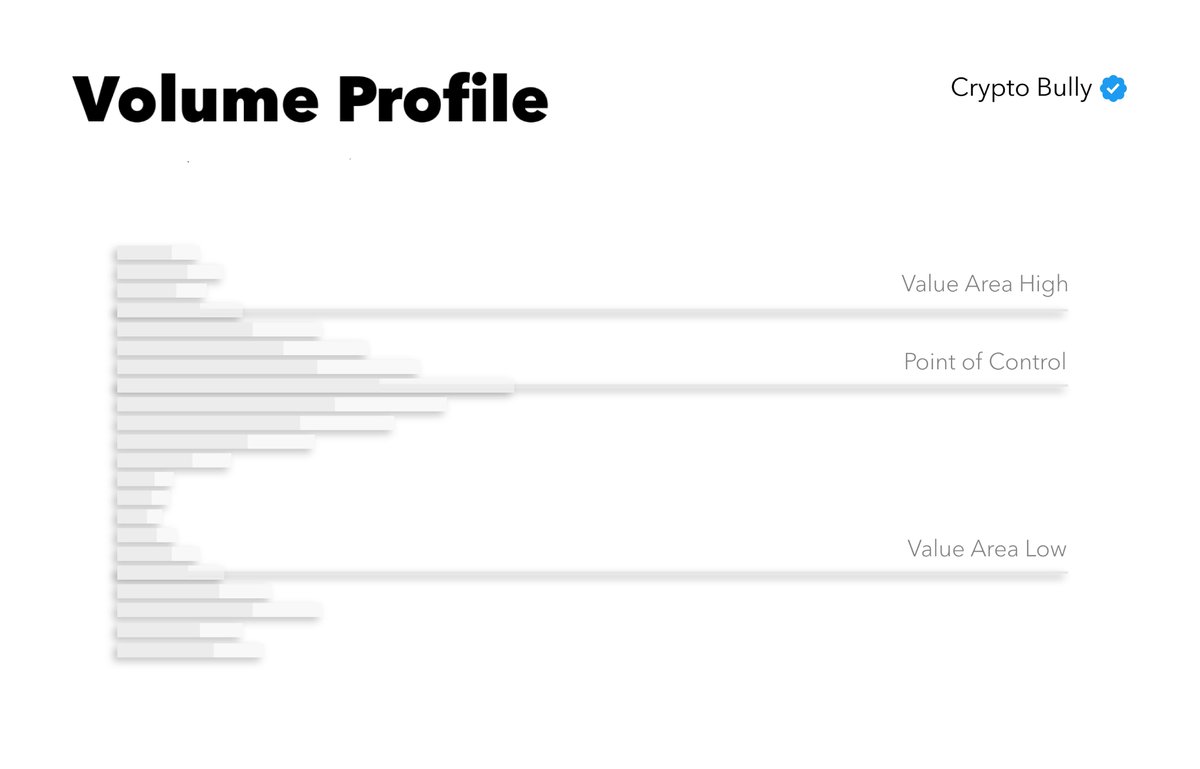
Introduction to Volume Profile
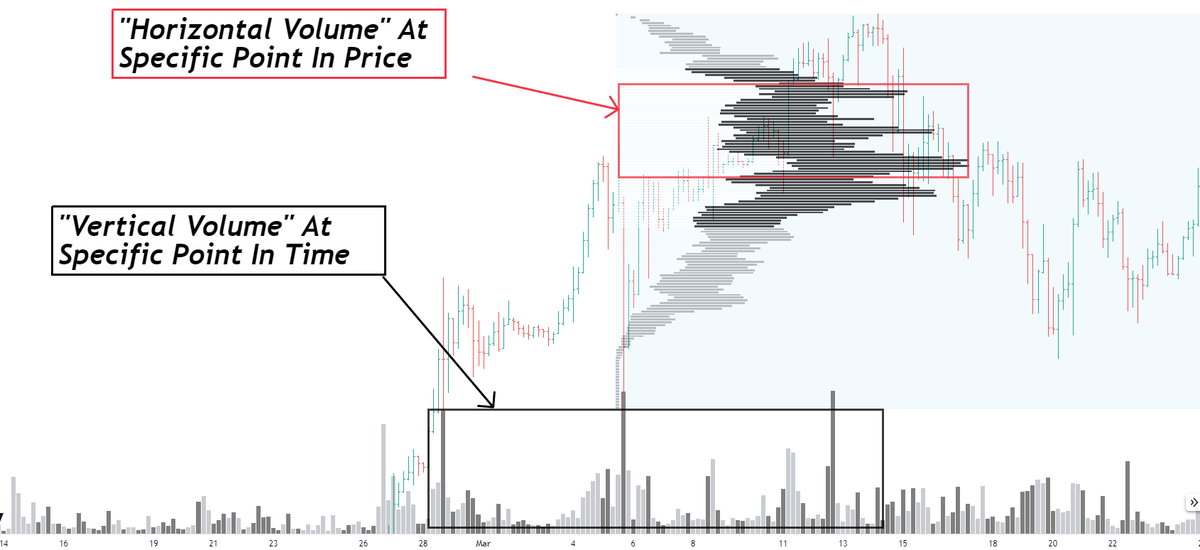
Volume Profile is an advanced tool that displays trading activity over a specified time period at specified price levels.
It plots a histogram on the vertical axis. Basically, this shows you volume at horizontal levels on the chart.
Unlike traditional volume indicators that show volume over time, Volume Profile shows how much volume traded at each price level.
Benefits of Using Volume Profile:
- Identify Key Support and Resistance Levels: Traders pinpoint where the highest trading activity has occurred, which often corresponds to strong support and resistance levels.
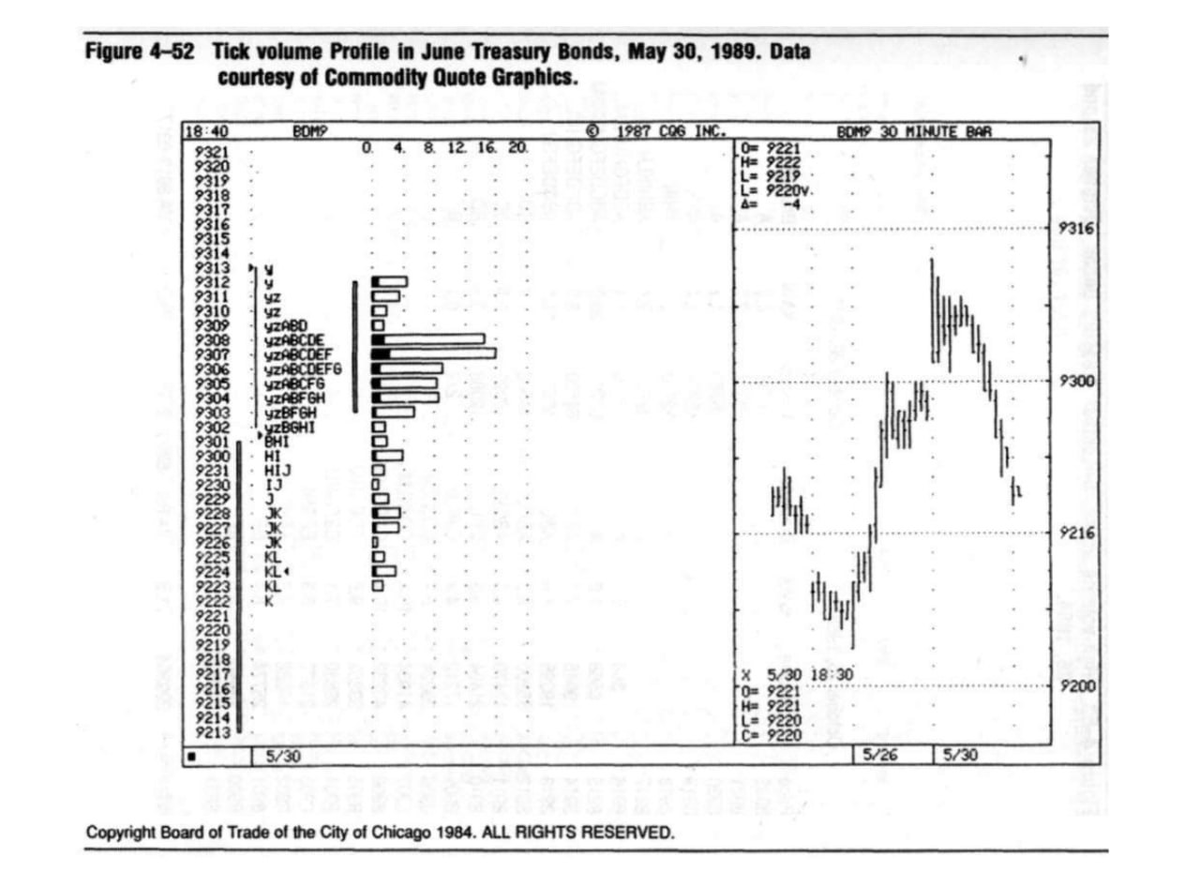
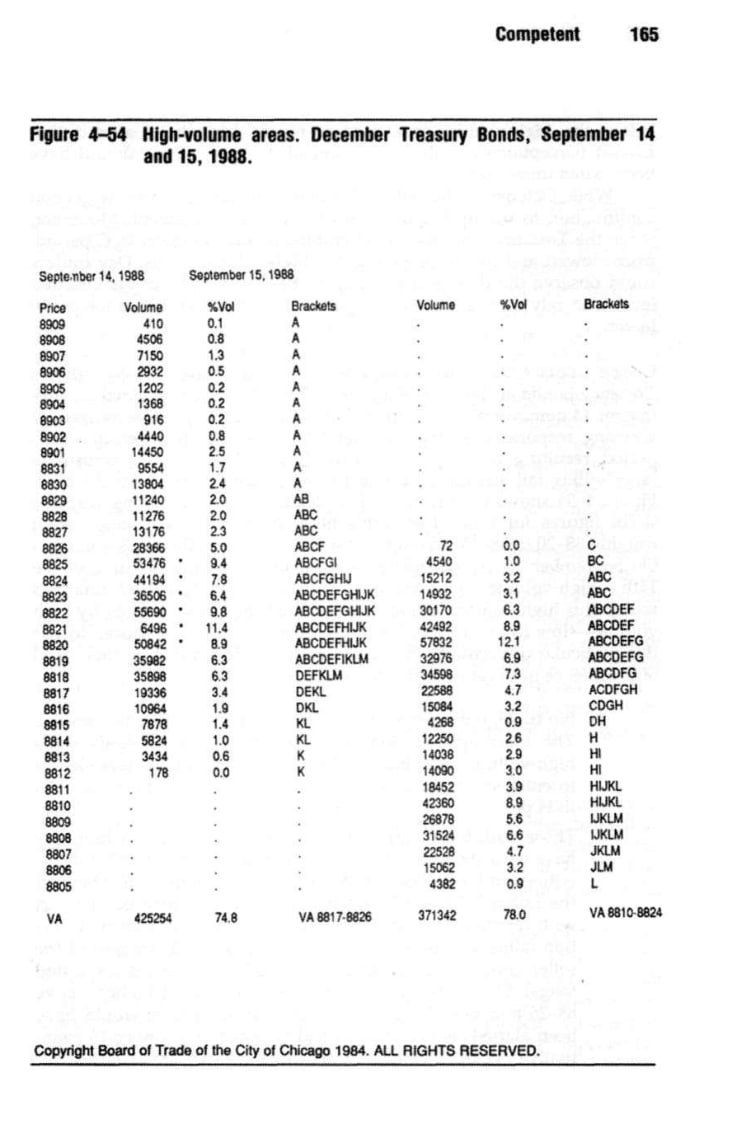
While the above tweet shows only bars, a lot of tools (including books from 1990 [refer photo] and advanced traders, actually use numbers - it is important to remember that every bar you see is all just data, this is not technical analysis, this is data-based trading. This is why it's effective)
- Understand Market Sentiment: By analyzing the volume at different price levels, you can gauge the strength of market movements and potential reversals.
- Improve Trade Entries and Exits: Knowing where significant volume has traded allows traders to make more informed decisions about entering and exiting trades.
- Identify Key Support and Resistance Levels: Traders pinpoint where the highest trading activity has occurred, which often corresponds to strong support and resistance levels.
While the above tweet shows only bars, a lot of tools (including books from 1990 [refer photo] and advanced traders, actually use numbers - it is important to remember that every bar you see is all just data, this is not technical analysis, this is data-based trading. This is why it's effective)
- Understand Market Sentiment: By analyzing the volume at different price levels, you can gauge the strength of market movements and potential reversals.
- Improve Trade Entries and Exits: Knowing where significant volume has traded allows traders to make more informed decisions about entering and exiting trades.
Definitions:
- A High Volume Node (HVN) is a price level where a significant amount of trading activity has occurred. These areas represent a consensus or fair value range where both buyers and sellers are actively participating.
Key quotes:
- "A trader has one job... to observe the story being told by the market as it develops vertically and horizontally." @Stoiiic
- J. Dalton (Mind Over Markets) emphasizes that understanding these volume nodes is crucial for interpreting market behavior and making informed trading decisions. (below is excerpt from Dalton's book)
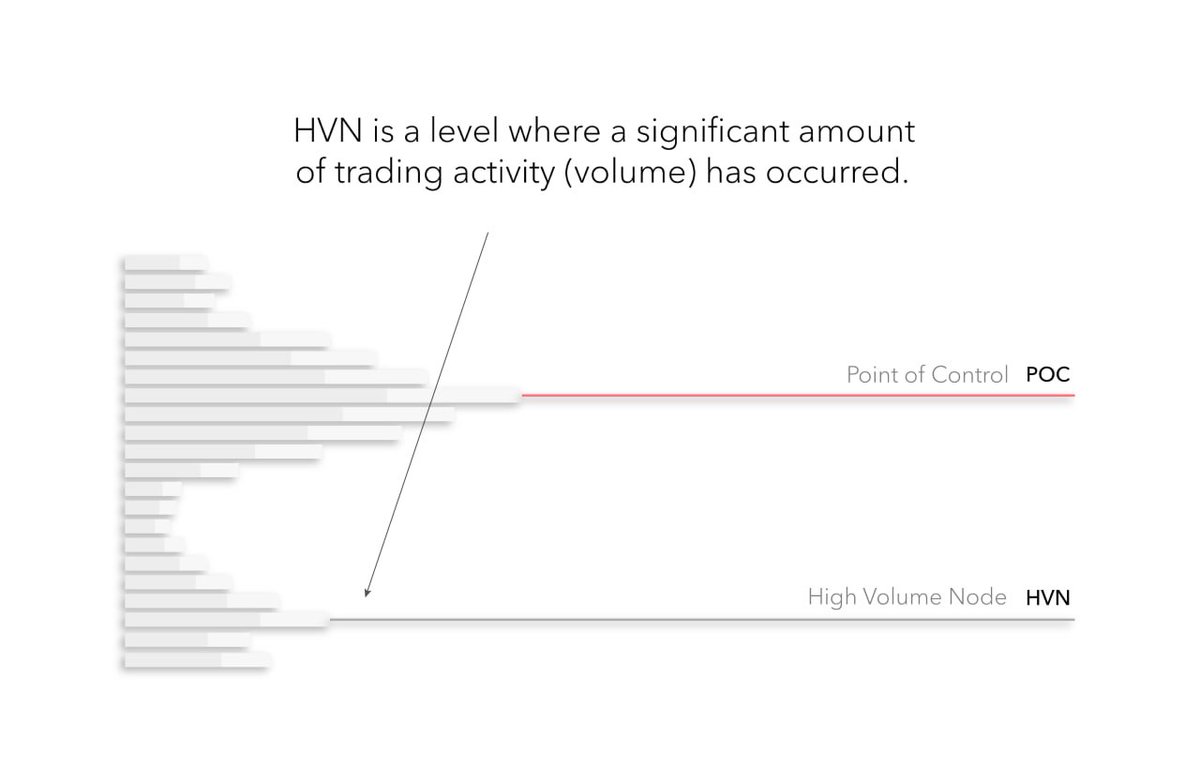
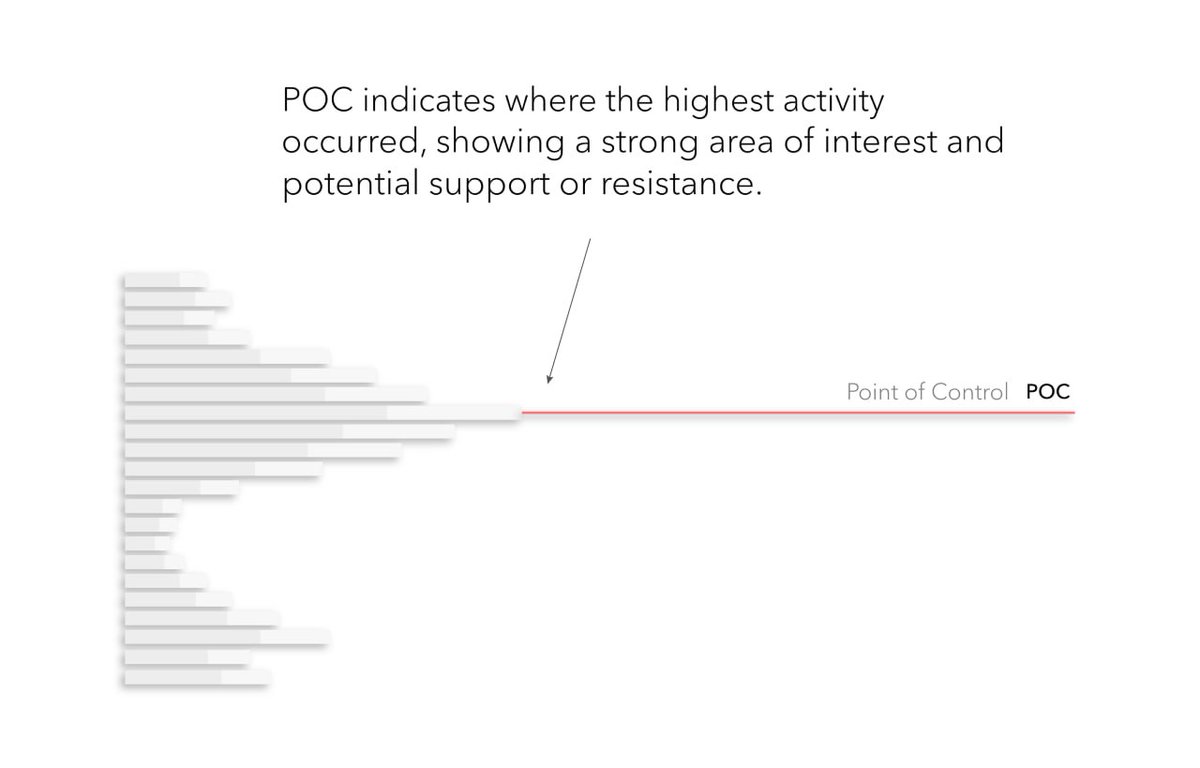
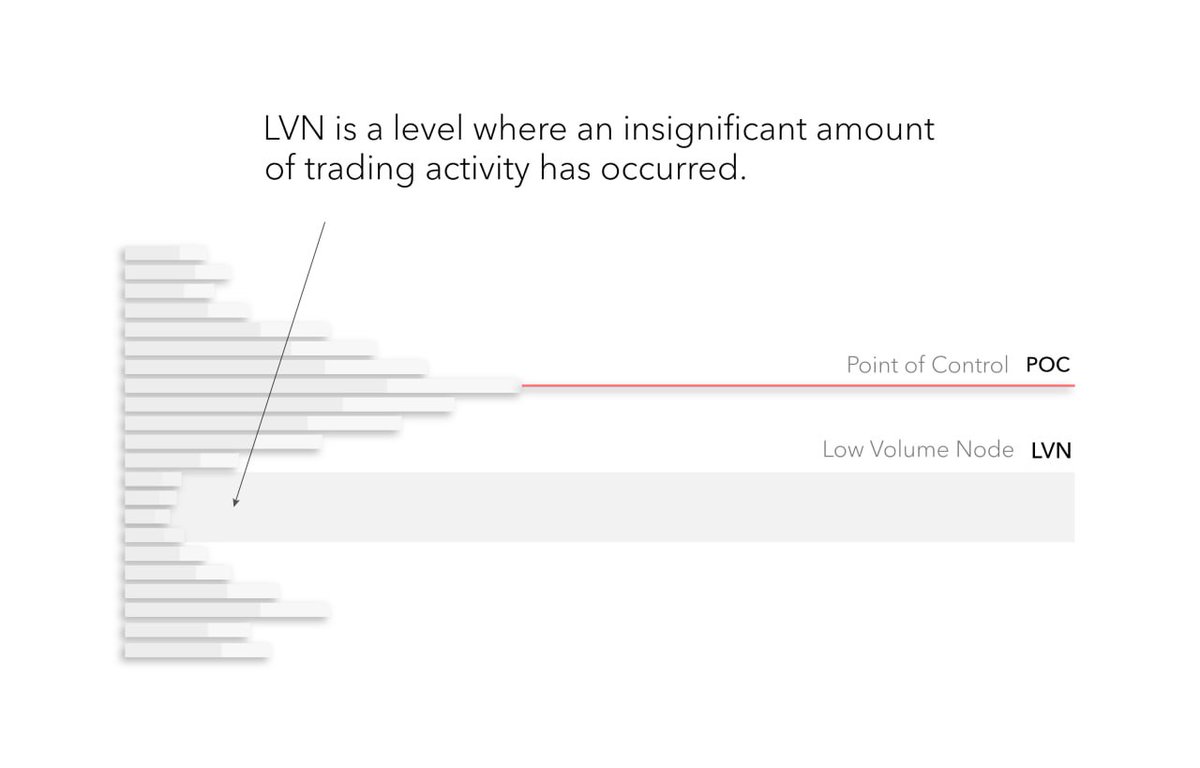
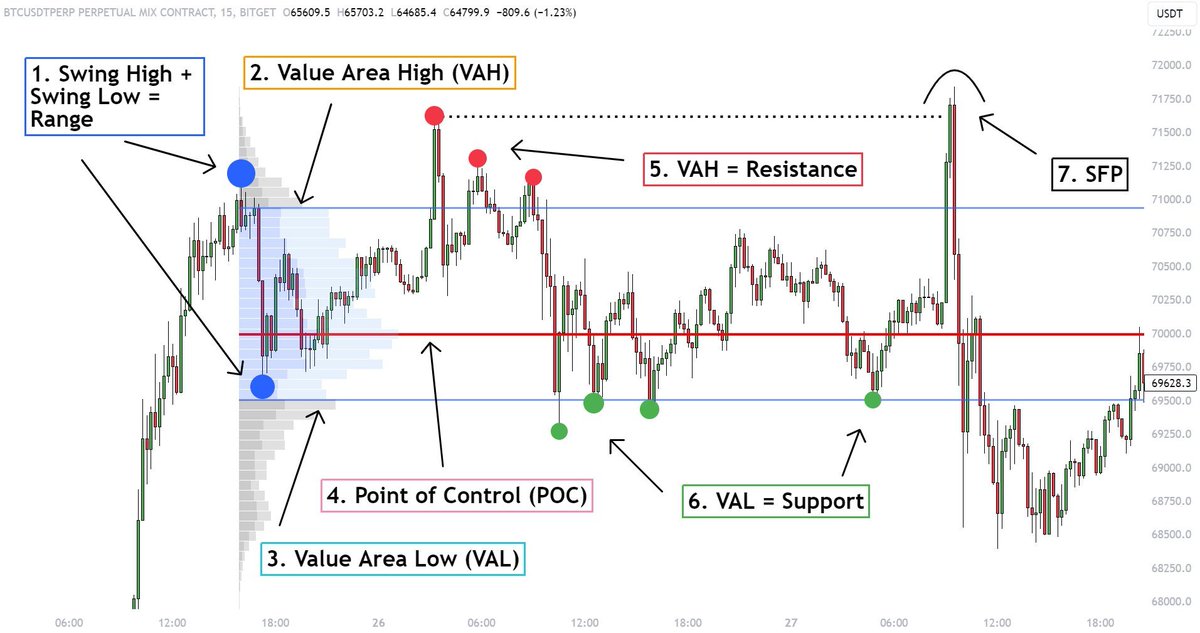
- The Point of Control (PoC) is the price level with the highest traded volume within a given period, making it a critical reference point. It represents the most accepted price by the market participants.
However, there can be multiple HVNs within a range, and the PoC is simply the most prominent one. (This is the "fairest" value for price - refer figure below from James Dalton)
However, there can be multiple HVNs within a range, and the PoC is simply the most prominent one. (This is the "fairest" value for price - refer figure below from James Dalton)
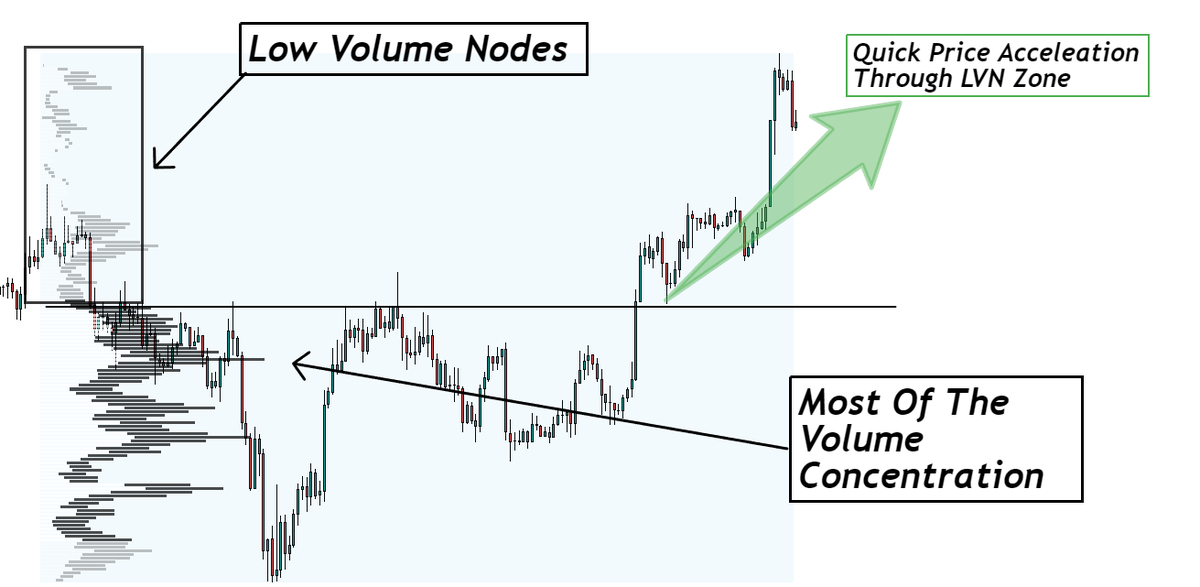
- Low Volume Nodes (LVNs) are price levels with minimal trading activity. These areas are often characterized by rejection or imbalance, where market participants did not find these prices attractive.
- LVNs represent "unfair" prices where the market quickly moves through, not allowing for substantial price development.
- LVNs represent "unfair" prices where the market quickly moves through, not allowing for substantial price development.
Characteristics:
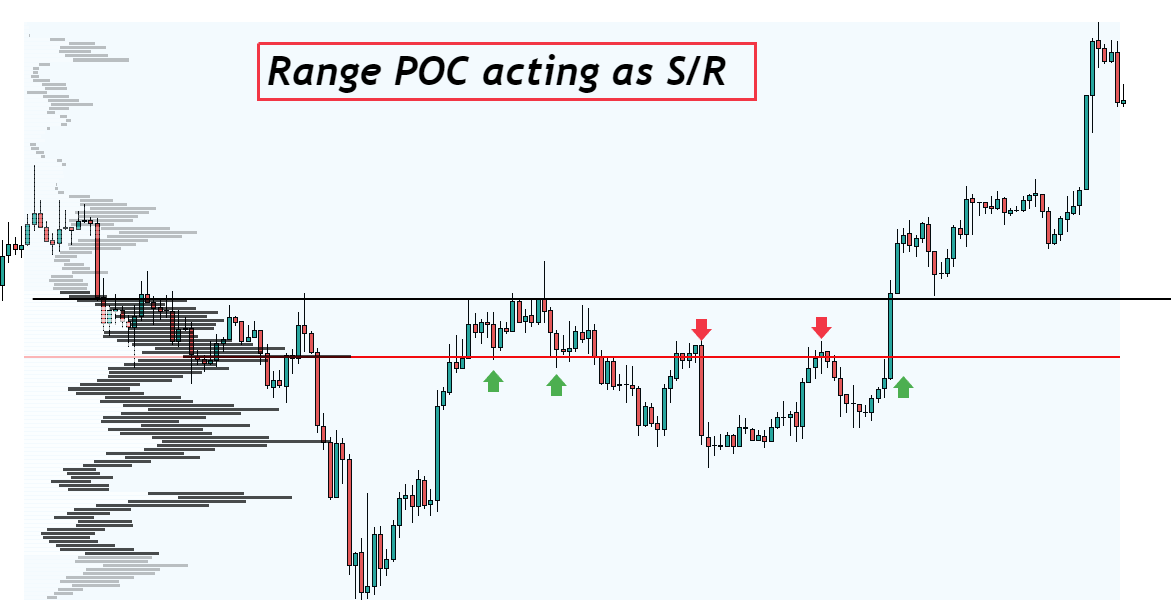
- The POC typically acts as a magnet for price action. Prices often gravitate towards the POC, where most of the trading volume has occurred.
- nPOCs (naked points of control) referring to the session (the entire day in crypto) often act as the most important price magnets.
- POCs can be used to identify significant levels for entry and exit points. When price moves away from the POC, it indicates a potential shift in market sentiment.
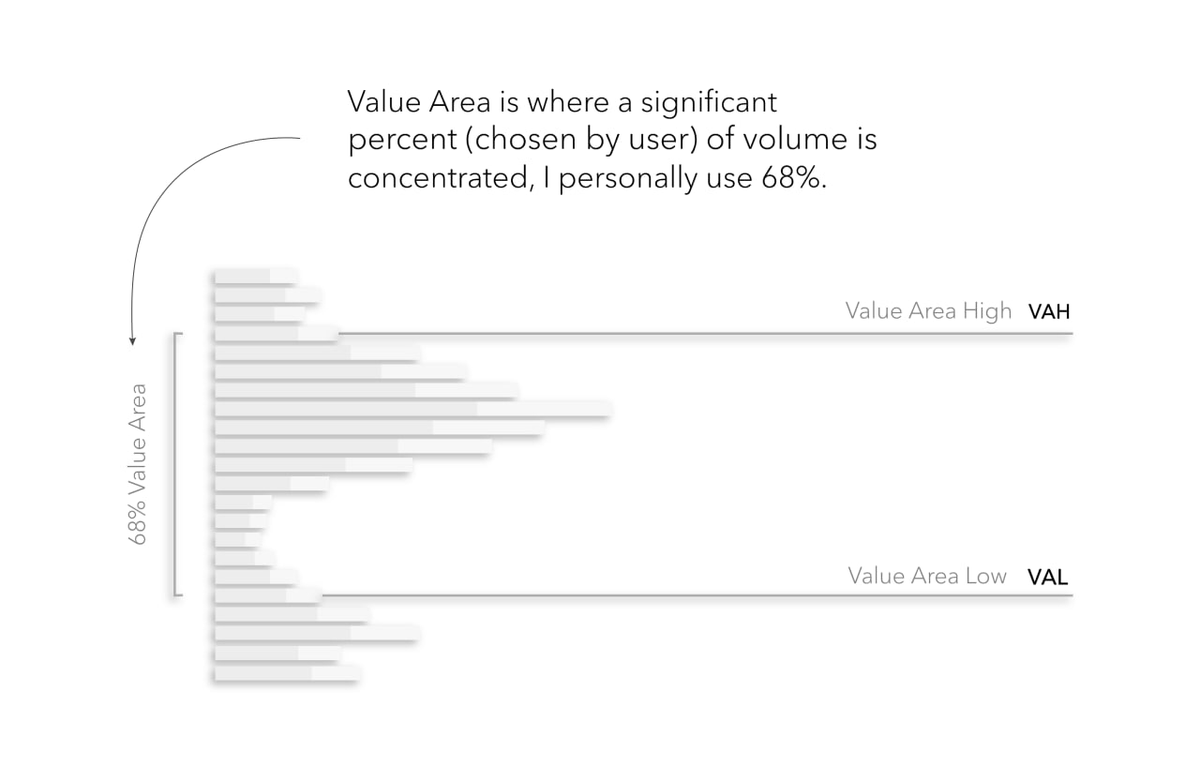
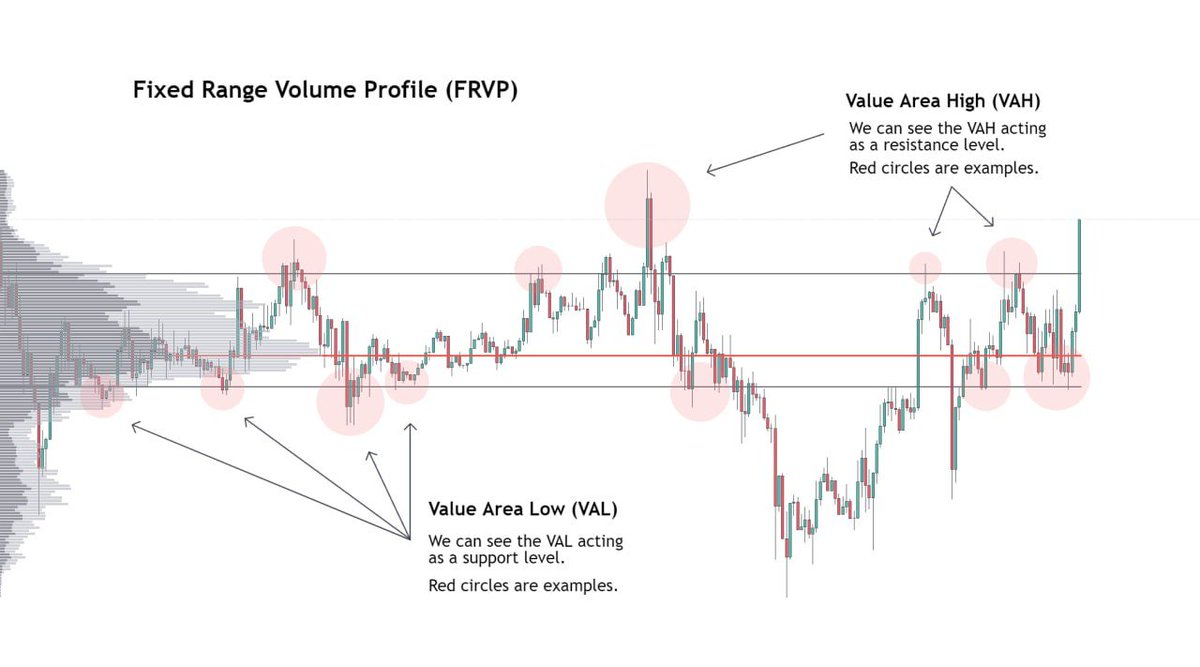
Value Area High (VAH) and Value Area Low (VAL)
Definition and Significance:
- The VaH and VaL represent the price levels that enclose the bulk of the trading activity, usually around 70% of the volume. (I like to use 68% in my settings)
- The area between the VAH and VAL is considered the Value Area, indicating where the majority of the market participants are trading.
Trading Implications:
- Support and Resistance: The VAH and VAL act as significant support and resistance levels. Prices often oscillate within this range, and breaking out of this range can signal a strong move.
- Trade Entries and Exits: Traders can use the VAH and VAL to identify optimal entry and exit points. For example, buying near the VAL and selling near the VAH can be a profitable strategy.
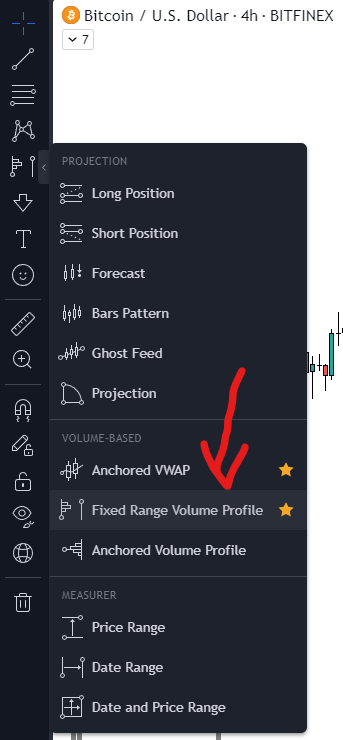
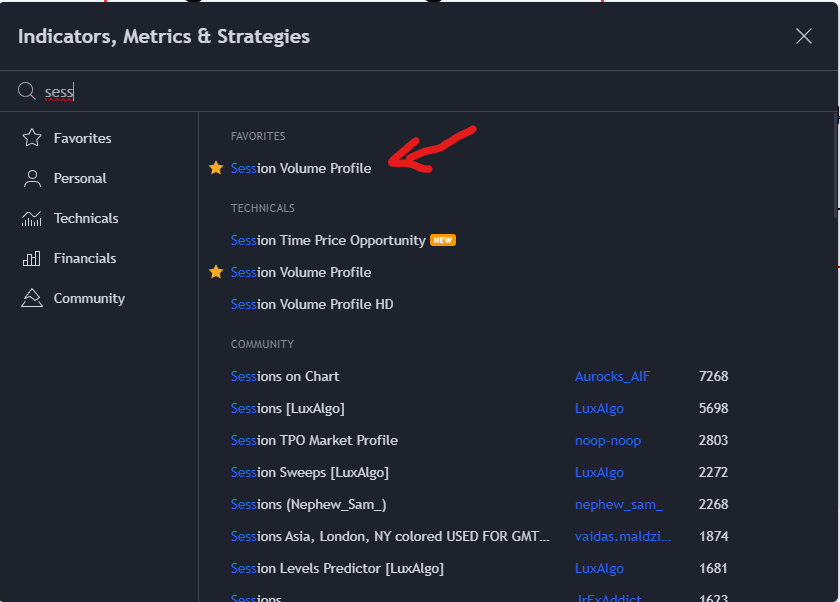
Volume Profile Tools (I use @tradingview for all these tools)
Fixed Range Volume Profile (FRVP):
- FRVP allows traders to analyze volume data within a specific range, providing detailed insights into market behavior during that period.
(how to find attached)
Visible Range Volume Profile (VRVP):
- VRVP displays the volume profile for the range visible on the chart. It dynamically adjusts as you zoom in or out, providing a flexible view of volume distribution.
Session Volume Profile (SVP):
- Same as FRVP but the fixed ranges are limited to a trading day (24 hour period each).
Case Study Example:
- Analyzing a recent ETH chart with composite volume profile shows how HVNs and LVNs acted as support and resistance during price movements. By observing these levels, traders can make more informed decisions.
- Analyzing a recent ETH chart with composite volume profile shows how HVNs and LVNs acted as support and resistance during price movements. By observing these levels, traders can make more informed decisions.
Identifying Key Levels:
- Use HVNs to identify strong support and resistance levels. These areas are likely to see significant trading activity and can provide reliable entry and exit points.
- Monitor LVNs for potential breakout or breakdown opportunities. Since these areas show minimal trading activity, prices can move quickly through them, offering swift trading opportunities.
Combining with Price Action:
- Integrate volume profile analysis with price action strategies to enhance trading decisions. Understanding how volume is distributed across price levels can provide deeper insights into market trends and potential reversals.

Trading Set-Up Using FRVP tool with other things:
All noted on chart for you to bookmark and save
All noted on chart for you to bookmark and save
That's about it for this tutorial, I hope this can get you started with volume profile and make this one of the most important tools in your trading arsenal.
I would like to thank the following traders who helped me learn a lot when I started and because of whom I am able to make detailed tutorials with actionable set-up sheets for you guys:
@Trader_Dante
@CryptoCred
@EmperorBTC
@Stoiiic
I would like to thank the following traders who helped me learn a lot when I started and because of whom I am able to make detailed tutorials with actionable set-up sheets for you guys:
@Trader_Dante
@CryptoCred
@EmperorBTC
@Stoiiic
Loading suggestions...