

Introduction:
Stochastic RSI is a momentum indicator combining Stochastic Oscillator & RSI. It oscillates between 0 and 100, providing more precise overbought/oversold levels.
1/

•Faster signals than traditional RSI
•Identifies potential reversals
•Helps confirm entry/exit points in conjunction with the price action
2/
•Above 80: Overbought (Potential Sell Zone)
•Below 20: Oversold (Potential Buy Zone)
But remember, context is key! Always combine with the price action.
3/

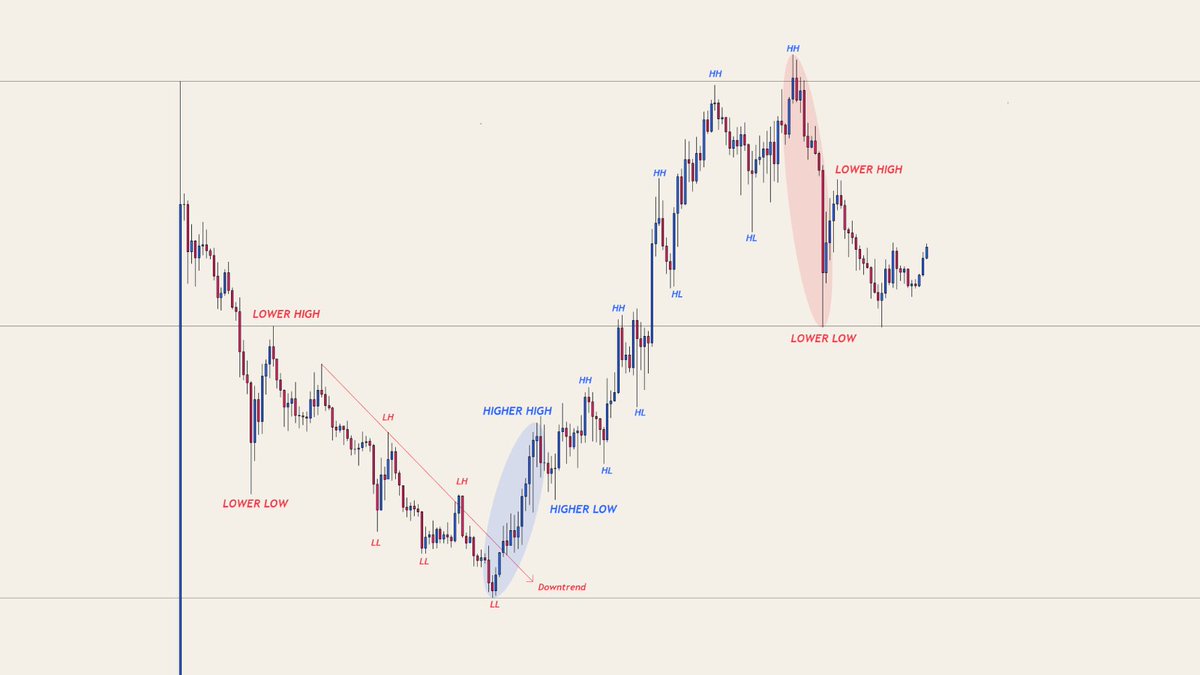
Market structure refers to the framework of price movement, identifying trends, ranges, and support/resistance.
•Higher highs & higher lows (uptrend), Lower highs & lower lows (downtrend)
•Price moves sideways between support & resistance
4/
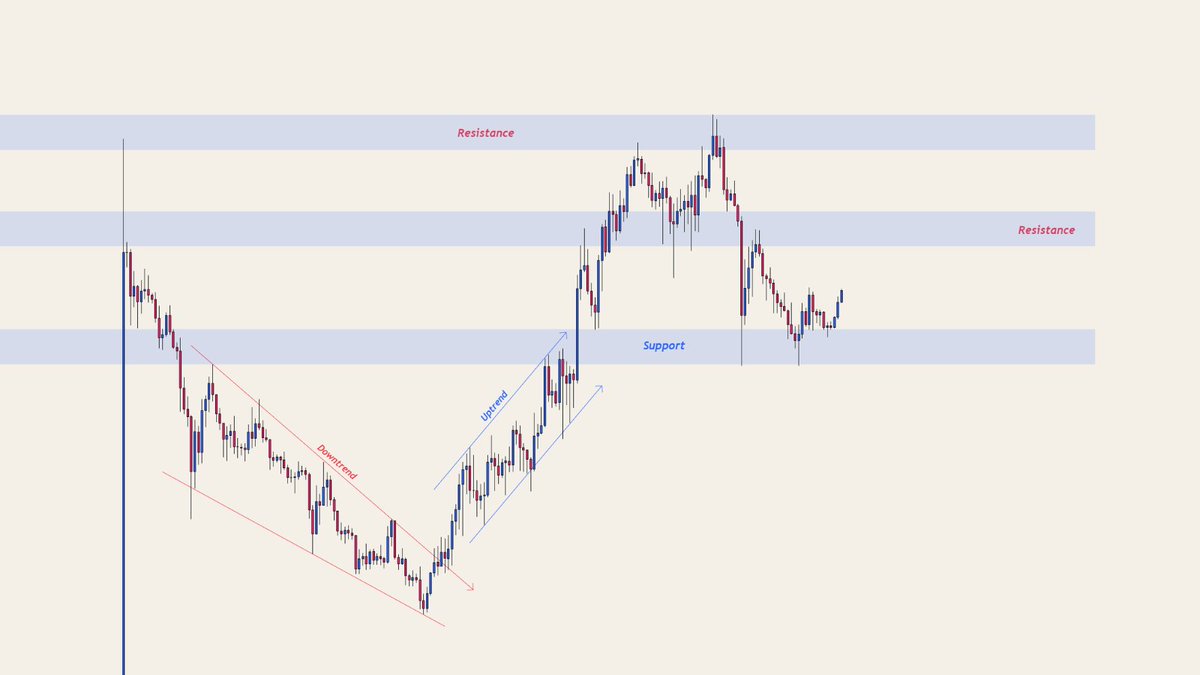
•Trend Lines: Connect highs/lows to visualize trends
•Support/Resistance: Identify key horizontal levels where the price reacts
•Price Patterns: Look for patterns like Head & Shoulders, Double Top/Bottom
5/
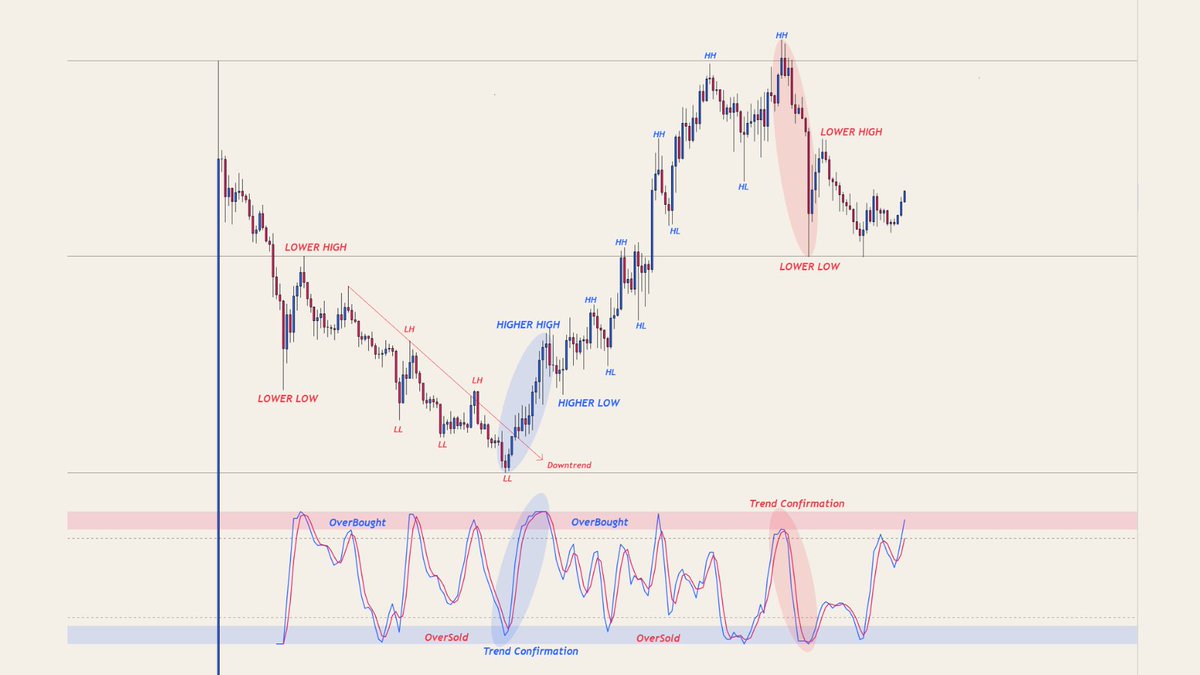
Trend Confirmation:
• In uptrend: Look for Stochastic RSI to move from oversold (20) to confirm bullish continuation
• In downtrend: Look for Stochastic RSI to move from overbought (80) to confirm the bearish continuation
6/
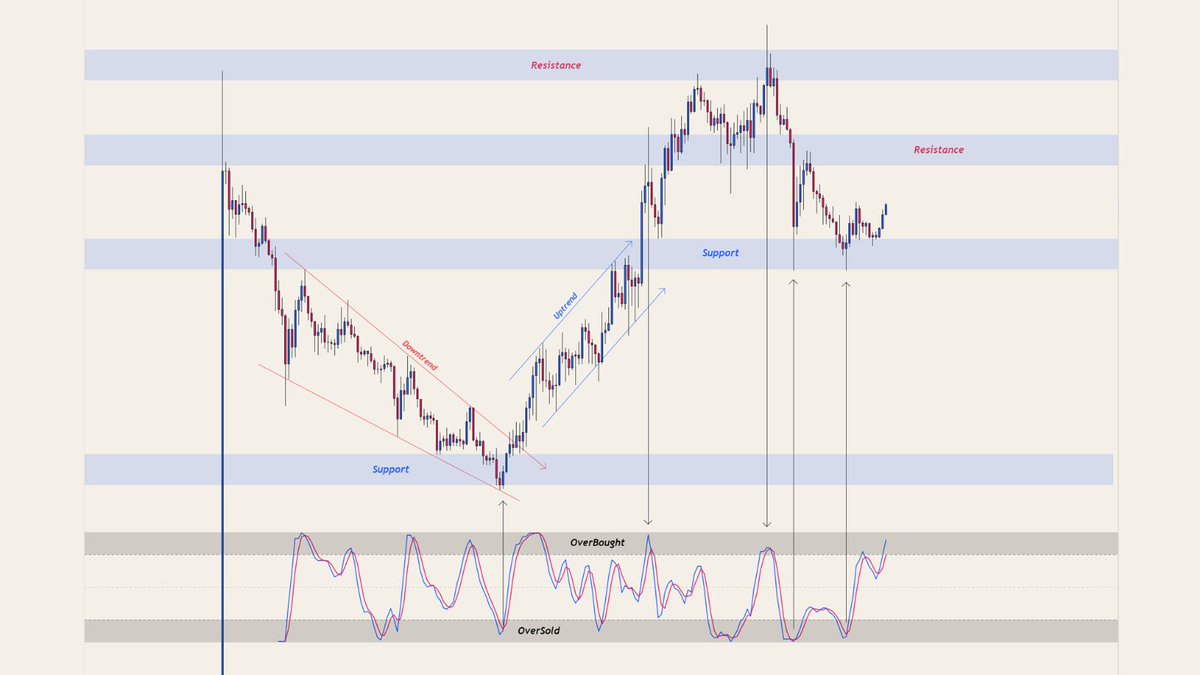
•Bullish Reversal: In a downtrend, the price hits strong support, and Stochastic RSI is oversold → Potential buy signal
•Bearish Reversal: In an uptrend, the price hits strong resistance, and Stochastic RSI is overbought → Potential sell signal
7/
•Bullish Divergence: Price makes lower low, Stochastic RSI makes higher low → Potential reversal up
•Bearish Divergence: Price makes higher high, Stochastic RSI makes lower high → Potential reversal down
8/

•Identify uptrend (higher highs & higher lows)
•Wait for price pullback to support
•Confirm Stochastic RSI in oversold (below 20)
•Enter a long position with the target at the previous high
9/
•Identify downtrend (lower highs & lower lows)
•Wait for price rally to resistance
•Confirm Stochastic RSI in overbought (above 0.8)
•Enter a short position with the target at the previous low
10/
Always use stop-loss to protect capital
•Place below support in bullish setups
•Place above resistance in bearish setups Risk only a small percentage of your capital per trade.
11/
Stochastic RSI is indeed a powerful tool but only if it's used with Market Structure & proper Risk Management.
That's the end. I hope this was helpful.
Leave a ❤️ & Follow @CryptoYoddha for more
More from this author
Introduction to Andrew’s Pitchfork 🧵 Andrew’s pitchfork is not very popular like the other tools but I have used it for several years and it works li...
Introduction to Harmonic Patterns 🧵 Harmonic Patterns are unique price formations that align with Fibonacci numbers and are used to predict potential...
"Your liquidation is their take-profit". Here in this thread we are going to look how our mind is playing with us. How we create a biased mindset ba...
In the past few months, you guys must have seen some hopium feeding charts in the form of On-chain data or market cycle patterns on your timeline. T...
Recent Threads
I’ve recently seen a lot of people criticizing smaller indie projects for releasing merchandise or doing kickstarter funding to fund their projects. T...

I compiled all the specific references I noticed in May's moveset! #イニブ #g_bd #g_bdr #GBDR https://t.co/PvNHzH6yj6

taekook taguan ng anak au wherein jk received a surprising gift from their xmas party… [ christmas special 🎄] https://t.co/WY3C450KpV

@HitWithAHeart I hear him before I see him. The weight of his steps on the stairs. Slower than usual. Measured. Like he’s already bracing for whatev...

(1/7) I'm not going to do a full trailer breakdown for Zach Cregger's Resident Evil film, since we have an early form of the script you can place a lo...

Nikola Jokic is 0-6 against 50+ win teams in the playoffs. https://t.co/l5hCeVCoUj

Popular Threads
DON'T ARGUE WITH DONKEYS (Fable) The donkey said to the tiger: - "The grass is blue". The tiger replied: - "No, the grass is green." The discussion...

These are the 41 most powerful tenants of Tateism for a man to live by. Wether you are Christian, Muslim; It doesn’t matter if you are strong, weak...

The ICT Mentorship Core Content Month 1 Summarized: https://t.co/6tXJxPMDhm

A thread: Pakistani newspaper Dawn's front pages from 4th december 1971 to 20 December to see how they kept their own people in the dark. This was on...

Top-40 Footballers with Most Goal Contributions (Goals + Assists) in history. [ A MEGA THREAD ] https://t.co/gAb3QcqdYQ

Here's 40 TikTok hooks that could make you go viral. (Not in any particular order) //THREAD//
