

If you are a newbie and confused as to how to navigate today's #crypto market then this thread is for you
It is crucial that you are able to find your own opportunities in this market.
From years of trading, here is the ULTIMATE guide to TA👇🧵
It is crucial that you are able to find your own opportunities in this market.
From years of trading, here is the ULTIMATE guide to TA👇🧵

➡️ TA is your best friend if you want to spot opportunities that would easily make you six figures.
Let's explore these strategies.
Let's explore these strategies.
1/ Understanding how TA works can be simple. Trading relies on consistency and discipline, not luck.
Every trade won't be a win; focus on long-term profitability and success!
Every trade won't be a win; focus on long-term profitability and success!
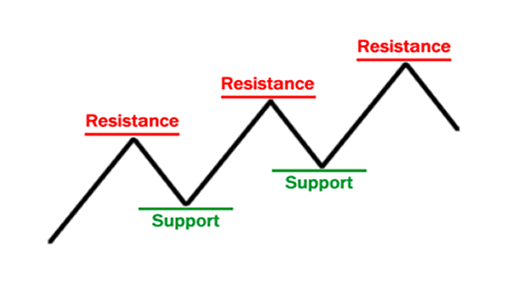
2/ Support and resistance are crucial concepts in the realm of trading.
Think of support as a bottom that typically halts the decline in prices, whereas resistance serves as a top that frequently caps price increases.
Think of support as a bottom that typically halts the decline in prices, whereas resistance serves as a top that frequently caps price increases.
3/ A breakthrough above resistance is generally a positive indicator for buyers, whereas a break below support is usually considered negative news.
4/ Here's how to profit:
Enter a position at the start of a bullish impulse.
Set a stop loss just below the close of that candle.
Do not rush the trade; allow the setup to form naturally.
Enter a position at the start of a bullish impulse.
Set a stop loss just below the close of that candle.
Do not rush the trade; allow the setup to form naturally.
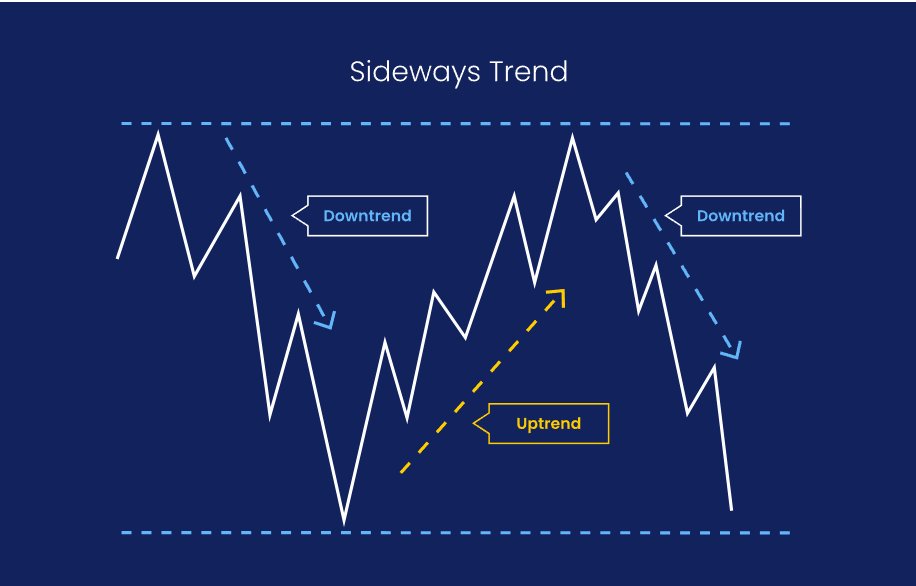
5/ Trends
There are certain patterns you must take note of:
Flat - When prices remain within the same range.
Uptrend - It occurs when new lows and highs exceed previous ones.
Downtrend- It occurs when new lows and highs are lower than the preceding ones.
There are certain patterns you must take note of:
Flat - When prices remain within the same range.
Uptrend - It occurs when new lows and highs exceed previous ones.
Downtrend- It occurs when new lows and highs are lower than the preceding ones.
6/ Use each instance to your advantage:
- During a downtrend, invest in lows and prioritize daily tasks.
- Flat - Trade cautiously and strategically.
- Invest aggressively during an uptrend but keep 50% of profits.
- During a downtrend, invest in lows and prioritize daily tasks.
- Flat - Trade cautiously and strategically.
- Invest aggressively during an uptrend but keep 50% of profits.
7/ Indicators
There are various indicators that, when combined, give you a greater chance at success; here are the important ones:
First is volume, which fuels price changes.
- Low volume indicates a weak trend
- High volume suggests a strong trend
Here is a breakdown:
There are various indicators that, when combined, give you a greater chance at success; here are the important ones:
First is volume, which fuels price changes.
- Low volume indicates a weak trend
- High volume suggests a strong trend
Here is a breakdown:
8/ - Price increases, but volume decreases, indicating a weak uptrend
- Price increase and volume increases indicates a strong uptrend
- Price decline and increased volume indicate a bearish trend
- Price and volume decreases indicate a weak bearish trend.
- Price increase and volume increases indicates a strong uptrend
- Price decline and increased volume indicate a bearish trend
- Price and volume decreases indicate a weak bearish trend.
9/ MACD: Moving Average Convergence Divergence.
MACD is a popular tool for tracking trends and indicating momentum.
Traders use MACD histogram to determine market momentum.
Identifies when an asset is overbought or oversold, indicating whether to sell or buy
MACD is a popular tool for tracking trends and indicating momentum.
Traders use MACD histogram to determine market momentum.
Identifies when an asset is overbought or oversold, indicating whether to sell or buy
10/ RSI (relative strength index)
RSI evaluates how quickly and how much prices change.
- If RSI falls below 30, the item is oversold and should be considered for a buy.
- If the RSI exceeds 70, the asset may be overbought and you should consider selling.
RSI evaluates how quickly and how much prices change.
- If RSI falls below 30, the item is oversold and should be considered for a buy.
- If the RSI exceeds 70, the asset may be overbought and you should consider selling.
- RSI around 50: neutral, balancing buying and selling.
11/ Moving Average (MA)
Moving average smooth pricing data is used to discover trends.
Consider 5-, 10-, and 20-period moving averages for short-term trading.
For long-term trading, employ 50, 100, and 200-period moving averages.
Moving average smooth pricing data is used to discover trends.
Consider 5-, 10-, and 20-period moving averages for short-term trading.
For long-term trading, employ 50, 100, and 200-period moving averages.
- Price over MA indicates an uptrend (buy), while below indicates a downtrend (sell).
12/ Bollinger Bands
Bollinger bands represent the range of price changes. The upper band represents overbought or overvalued conditions.
The lower band represents oversold or undervalued situations.
They are often combined with other techniques for enhanced analysis.
Bollinger bands represent the range of price changes. The upper band represents overbought or overvalued conditions.
The lower band represents oversold or undervalued situations.
They are often combined with other techniques for enhanced analysis.
13/ Some key things to note
Instead of employing too many indicators, focus on mastering one or two. A promising chart with strong indications facilitates trading.
Remember to evaluate fundamentals and market conditions.
Instead of employing too many indicators, focus on mastering one or two. A promising chart with strong indications facilitates trading.
Remember to evaluate fundamentals and market conditions.
And that's it!
If you enjoyed this thread
1. Follow me @cyrilXBT and turn on notifications so you don't miss out! 🔔
2. Like/Retweeting the first tweet below would mean a lot to me 👇 ❤️
If you enjoyed this thread
1. Follow me @cyrilXBT and turn on notifications so you don't miss out! 🔔
2. Like/Retweeting the first tweet below would mean a lot to me 👇 ❤️
Loading suggestions...