

The IV curve, or volatility surface, describes how IV varies across different strikes and expirations.
Understanding the IV curve as a function of expiration is essential for option traders
The Implied Volatility Curve as a Function of Expiration🧵
Understanding the IV curve as a function of expiration is essential for option traders
The Implied Volatility Curve as a Function of Expiration🧵
Key Characteristics
Volatility Surface Construction:
The volatility surface is a three-dimensional plot where the axes represent strike price (x-axis), time to expiration (y-axis), and implied volatility (z-axis).
Volatility Surface Construction:
The volatility surface is a three-dimensional plot where the axes represent strike price (x-axis), time to expiration (y-axis), and implied volatility (z-axis).
Each option, defined by its strike price and maturity, has a specific implied volatility, which collectively forms the volatility surface.
The shape of the surface can provide insights into market expectations and trading opportunities.
The shape of the surface can provide insights into market expectations and trading opportunities.
Term Structure of Volatility:
The term structure of volatility, often represented as a curve, shows how implied volatility changes with different expiration dates.
The term structure of volatility, often represented as a curve, shows how implied volatility changes with different expiration dates.
It helps in understanding the pricing of options with varying maturities and the market's perception of risk over different time horizons.
Shape and Slope:
Short-term Options: The IV curve for short-term options is often steeper and more convex due to higher sensitivity to recent price movements and volatility spikes.
Short-term Options: The IV curve for short-term options is often steeper and more convex due to higher sensitivity to recent price movements and volatility spikes.
Long-term Options: The IV curve for long-term options is usually flatter, as long-term volatility is influenced more by macroeconomic factors than short-term fluctuations.
Mathematical Representation
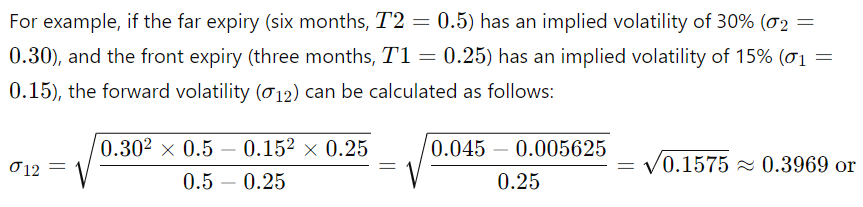
Forward Volatility Calculation: The implied volatility between two time points, T1 and T2 can be calculated using the following formula:
Forward Volatility Calculation: The implied volatility between two time points, T1 and T2 can be calculated using the following formula:

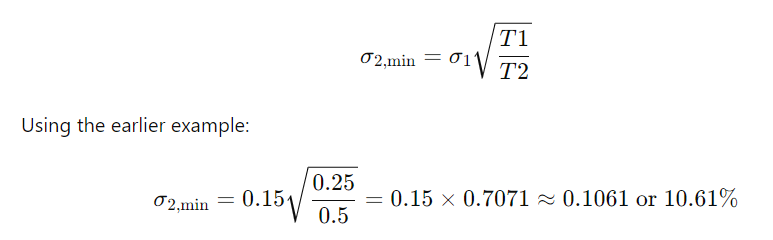
Lower Bound of Second Month's Volatility:
To avoid negative values under the square root function, there is a lower bound for the second month's volatility:
To avoid negative values under the square root function, there is a lower bound for the second month's volatility:
Practical Considerations
Market expectations of future economic events such as earnings reports, macroeconomic data releases or geopolitical events, influence implied volatility for different maturities
The IV curve can indicate anticipated market volatility around these events
Market expectations of future economic events such as earnings reports, macroeconomic data releases or geopolitical events, influence implied volatility for different maturities
The IV curve can indicate anticipated market volatility around these events
Demand and Supply:
The demand and supply dynamics in the options market for different expirations shape the IV curve.
Higher demand for short-term hedging can steepen the short end of the term structure, while demand for long-term protection affects the long end.
The demand and supply dynamics in the options market for different expirations shape the IV curve.
Higher demand for short-term hedging can steepen the short end of the term structure, while demand for long-term protection affects the long end.
Risk Management:
Traders use the term structure of volatility to manage risk effectively.
Long-term options may hedge against long-term uncertainties, while short-term options may be traded more actively based on short-term market views.
Traders use the term structure of volatility to manage risk effectively.
Long-term options may hedge against long-term uncertainties, while short-term options may be traded more actively based on short-term market views.
Example from Equities
In equity markets, the implied volatility surface often reflects the expected behavior of the underlying asset.
For example, equity indices may show higher volatility for near-term options, indicating market uncertainty about upcoming events.
In equity markets, the implied volatility surface often reflects the expected behavior of the underlying asset.
For example, equity indices may show higher volatility for near-term options, indicating market uncertainty about upcoming events.
Commodities Markets:
In commodities, different expiration dates may correspond to different underlying fundamentals, such as different crop seasons or oil extraction periods.
In commodities, different expiration dates may correspond to different underlying fundamentals, such as different crop seasons or oil extraction periods.
This can cause distinct volatility patterns for different maturities, with factors like supply, demand, and seasonality playing significant roles.
Stochastic Volatility Models:
Models like the Heston model describe the evolution of volatility as a stochastic process.
These models help in understanding the dynamic behavior of the IV curve over time and provide a more robust framework for options pricing.
Models like the Heston model describe the evolution of volatility as a stochastic process.
These models help in understanding the dynamic behavior of the IV curve over time and provide a more robust framework for options pricing.
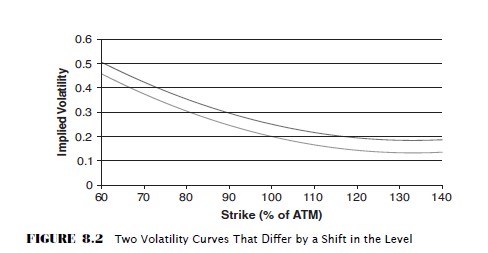
Smile Dynamics:
The volatility smile, which shows how IV varies with strike prices, interacts with the term structure.
Understanding the joint dynamics of the smile and term structure is crucial for accurate modeling and risk management.
The volatility smile, which shows how IV varies with strike prices, interacts with the term structure.
Understanding the joint dynamics of the smile and term structure is crucial for accurate modeling and risk management.
Loading suggestions...