

⚡️ All in one CHARTINK dashboard for scanning & market breadth
✅ These scanners are best for Swing & Positional trading
@OmkarBanne 🤝 @StockyMind
Like 🩷 Retweet 🔁 if you find it useful!
👉 Send a DM to access this Dashboard👇
✅ These scanners are best for Swing & Positional trading
@OmkarBanne 🤝 @StockyMind
Like 🩷 Retweet 🔁 if you find it useful!
👉 Send a DM to access this Dashboard👇
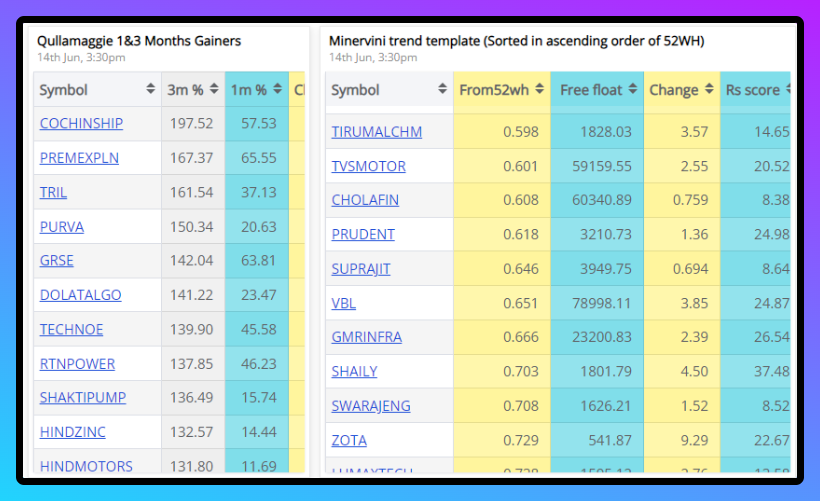
⚡️ 1 & 3-month gainers
This widget gives stocks that moved highest in the same period and one can look for tightness around EMAs for low-risk reward entry points!
⚡️ MMT - Mar Mivervini Trend Template
This gives stocks trading near 52-week highs and one can look for VCP pattern entries here.
This widget gives stocks that moved highest in the same period and one can look for tightness around EMAs for low-risk reward entry points!
⚡️ MMT - Mar Mivervini Trend Template
This gives stocks trading near 52-week highs and one can look for VCP pattern entries here.
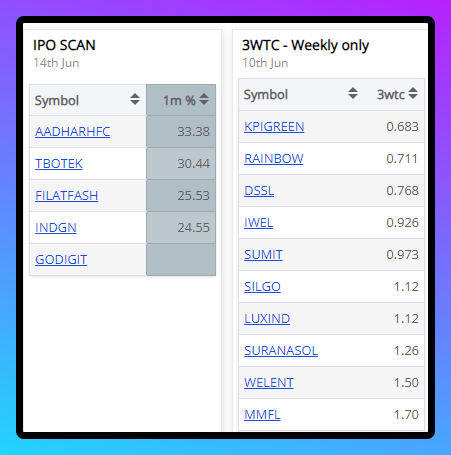
⚡️IPO Scan
This helps identify recent stock listing
⚡️ 3WTC
This gives stocks that have been trading in a tight range for the last 3 weeks (This widget uses weekly candles, better to use it on weekends)
This helps identify recent stock listing
⚡️ 3WTC
This gives stocks that have been trading in a tight range for the last 3 weeks (This widget uses weekly candles, better to use it on weekends)
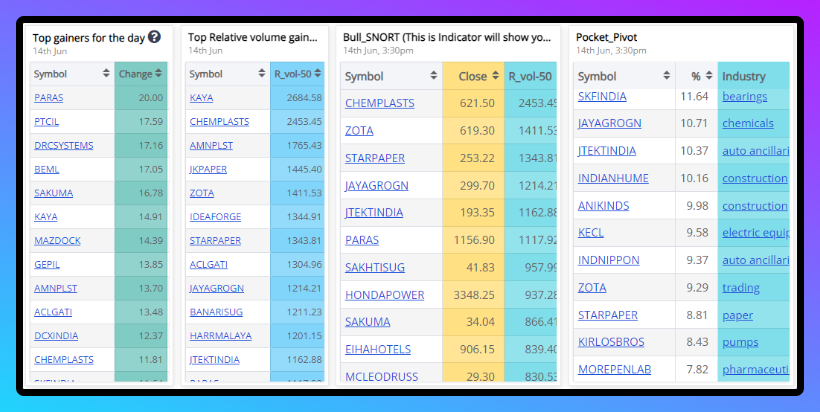
⚡️ Top Gainers
This gives top gainers of the day and this helps find hot themes/industries
⚡️Bull Snort
This widget shows stocks with strong buying force - Current volume greater than 2-3 times its average volume.
This gives top gainers of the day and this helps find hot themes/industries
⚡️Bull Snort
This widget shows stocks with strong buying force - Current volume greater than 2-3 times its average volume.
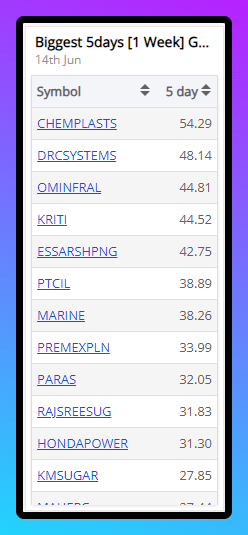
⚡️ Biggest 5D Gainer
It gives stocks that are up >10% in the last 5 days, one can also adjust settings and use 20% instead of 10%
It gives stocks that are up >10% in the last 5 days, one can also adjust settings and use 20% instead of 10%
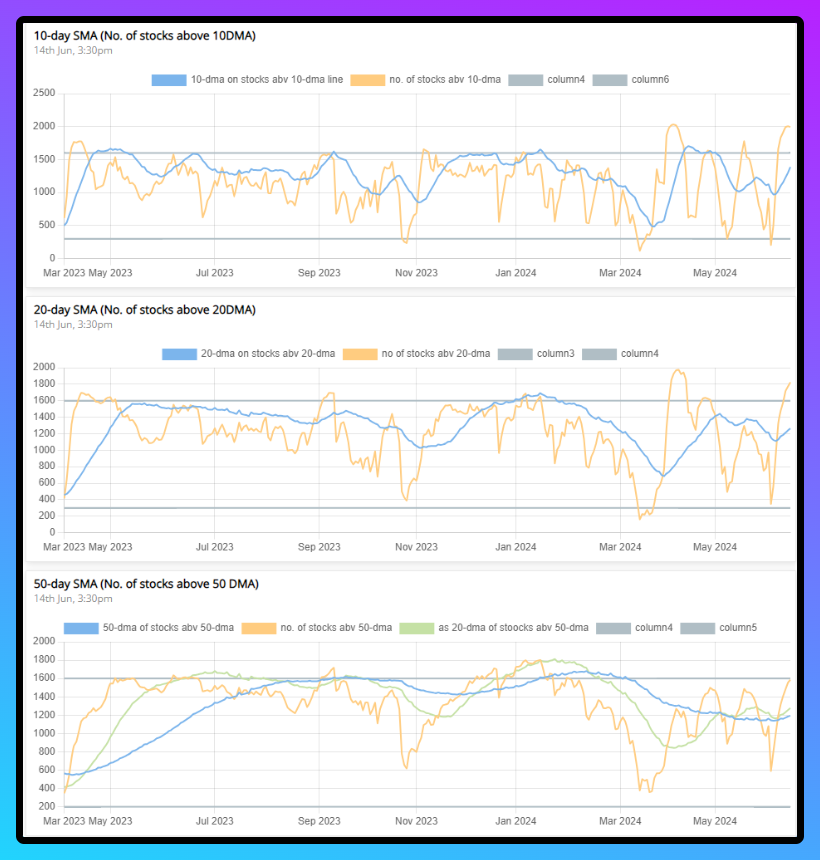
⚡️ Market Breadth
This table shows the number of stocks above 10, 20, and 50-day moving averages.
The line chart helps find the extreme zones where the probability of reversal is high.
This table shows the number of stocks above 10, 20, and 50-day moving averages.
The line chart helps find the extreme zones where the probability of reversal is high.
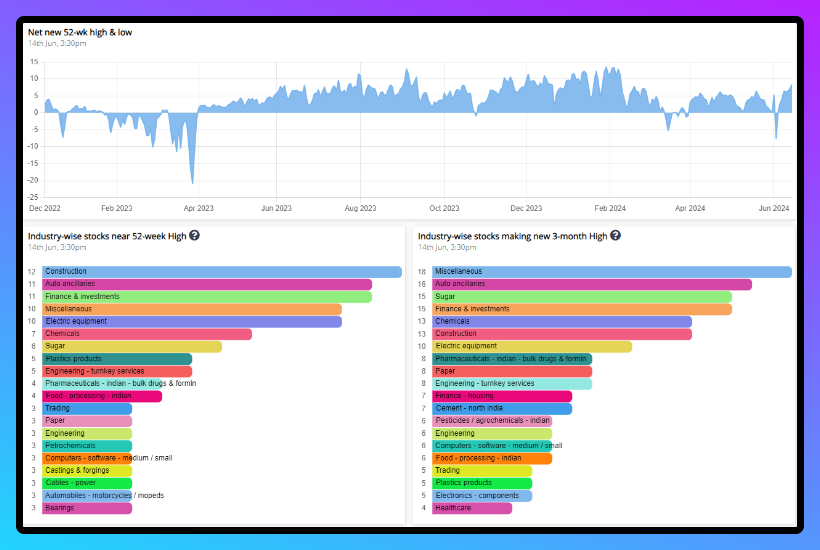
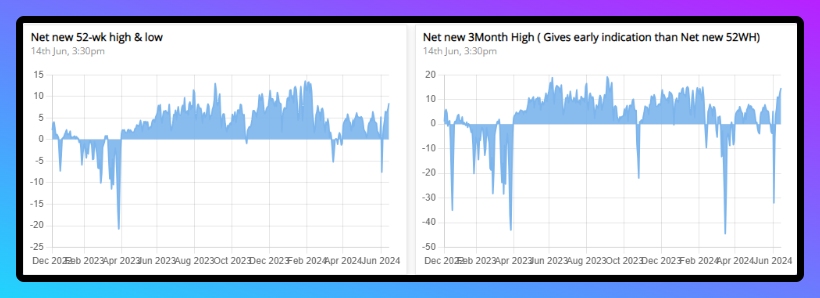
⚡️ Net New Highs (52-week, 3-month)
This widget shows net new 52-week and 3-month high stocks.
This widget shows net new 52-week and 3-month high stocks.
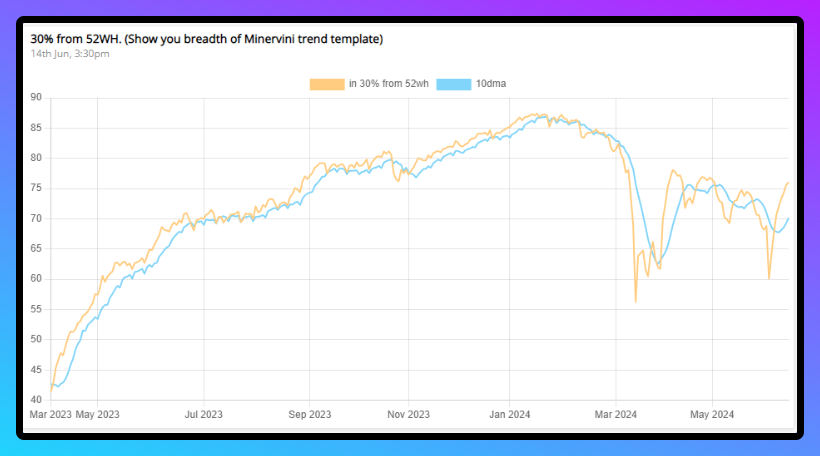
⚡️ 30% from 52-week high
It shows the percentage of stocks trading within 30% of their 52-week high
It shows the percentage of stocks trading within 30% of their 52-week high
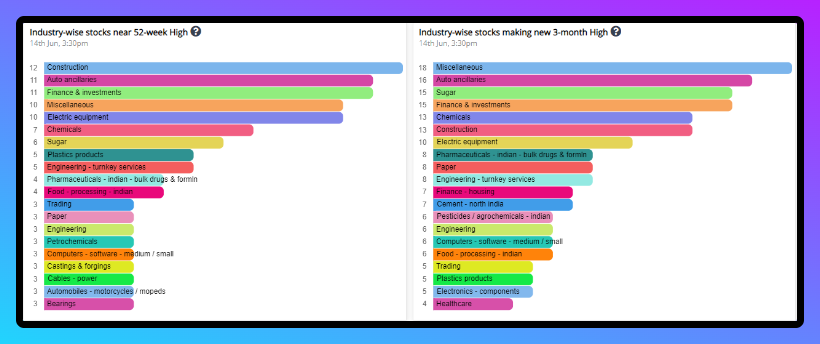
⚡️ Industry-wise stocks near 52-week High
This table shows the number of stocks making new 52-week and 3-month highs. This helps find a leading industry.
This table shows the number of stocks making new 52-week and 3-month highs. This helps find a leading industry.
Get this dashboard in your inbox
Like 🩷 Retweet 🔁 Send DM📩 to @DSS_Rajput007
Subscribe ➡️ tinyurl.com
Follow ➡️ x.com
x.com
Like 🩷 Retweet 🔁 Send DM📩 to @DSS_Rajput007
Subscribe ➡️ tinyurl.com
Follow ➡️ x.com
x.com
Loading suggestions...