

In this THREAD I will explain “Price Action”
1. Market Structure Shift
2. CISD
3. FVGs and Liquidity Sweeps
4. Draw on Liquidity
🧵(1/9)
1. Market Structure Shift
2. CISD
3. FVGs and Liquidity Sweeps
4. Draw on Liquidity
🧵(1/9)
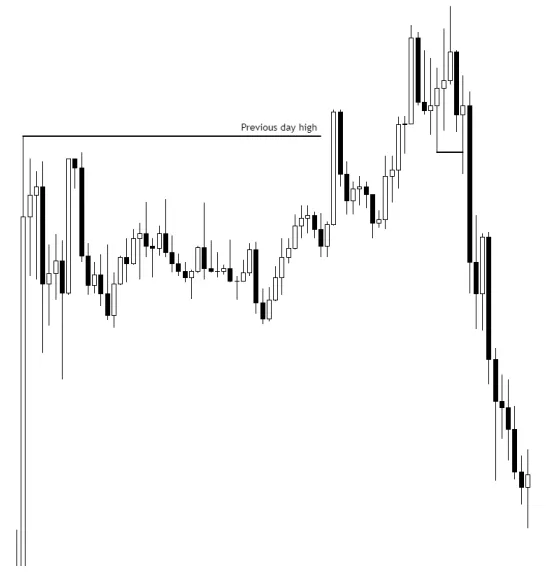
1. Market Structure Shift
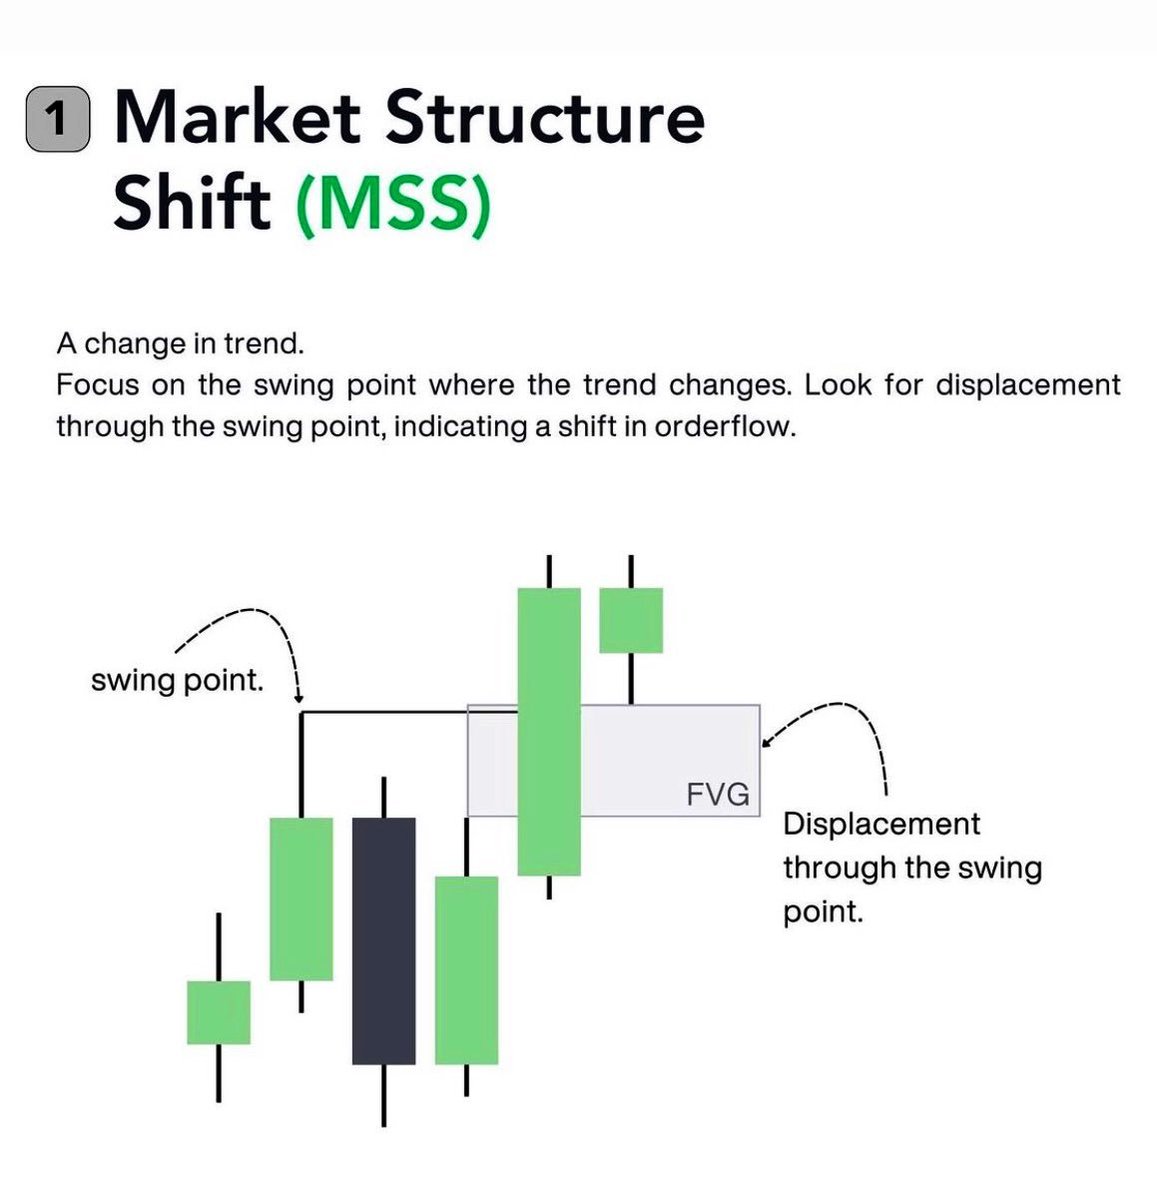
This occurs when price moves beyond an old level of structure and quickly reverses with displacement.
Displacement indicates that the market is reversing and involves significant participation from large players.
This occurs when price moves beyond an old level of structure and quickly reverses with displacement.
Displacement indicates that the market is reversing and involves significant participation from large players.
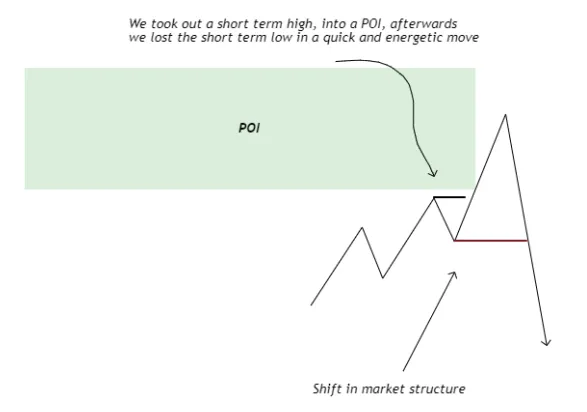
1.2 Market Structure Shift
In the image provided you can see a schematic of a bearish shift in market structure.
Price takes a short term high and traded into a point of interest which is mapped out as the green shaded area.
There's a SHIFT in the MS after touching the POI
In the image provided you can see a schematic of a bearish shift in market structure.
Price takes a short term high and traded into a point of interest which is mapped out as the green shaded area.
There's a SHIFT in the MS after touching the POI
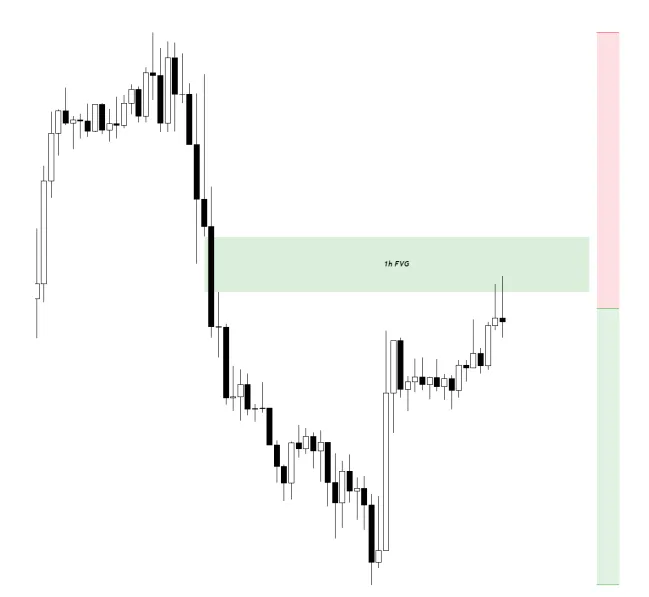
1.3 Market Structure Shift
In this image, price traded into a point of interest in a premium area.
Price should reverse in the POI, and make a Market Structure Shift.
The point of interest in this case is a 1 hour FVG.
In this image, price traded into a point of interest in a premium area.
Price should reverse in the POI, and make a Market Structure Shift.
The point of interest in this case is a 1 hour FVG.
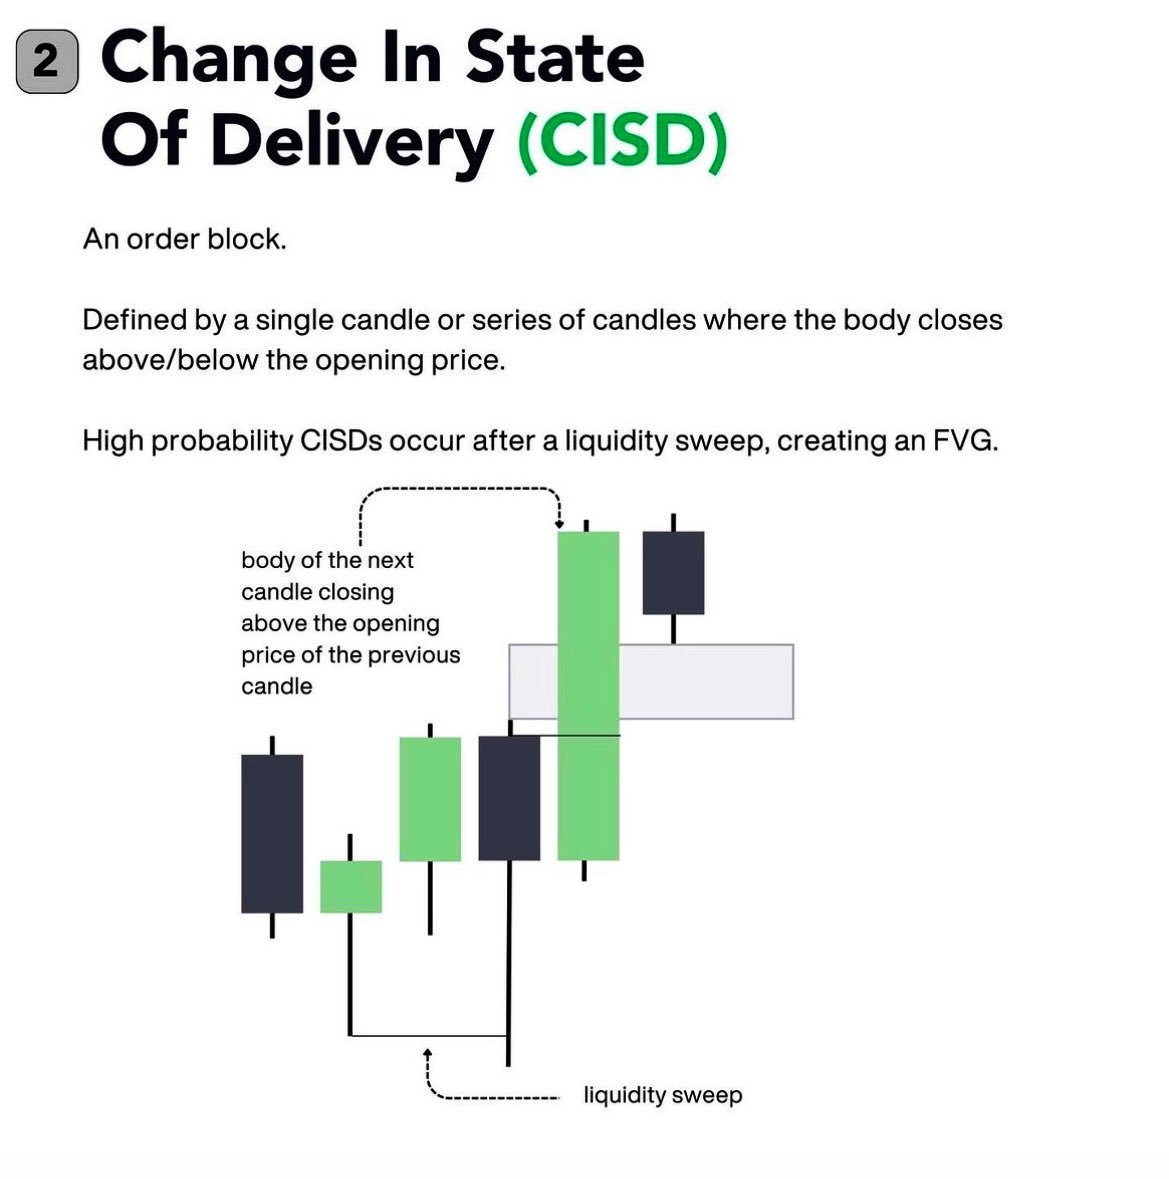
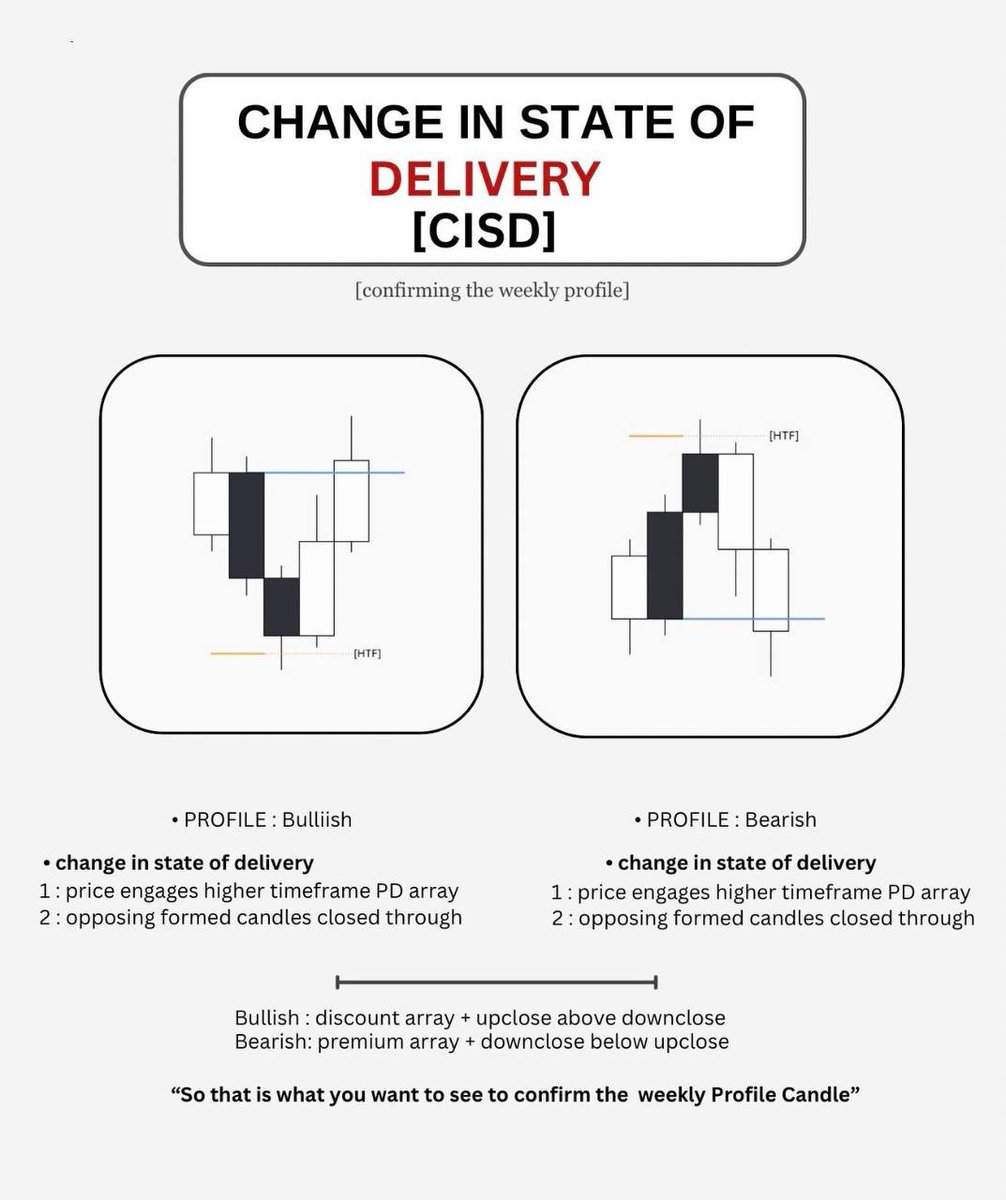
2. CISD
A change in the state of delivery occurs when bullish momentum suddenly shifts to bearish, or vice versa.
Signaling a potential market reversal.
A change in the state of delivery occurs when bullish momentum suddenly shifts to bearish, or vice versa.
Signaling a potential market reversal.
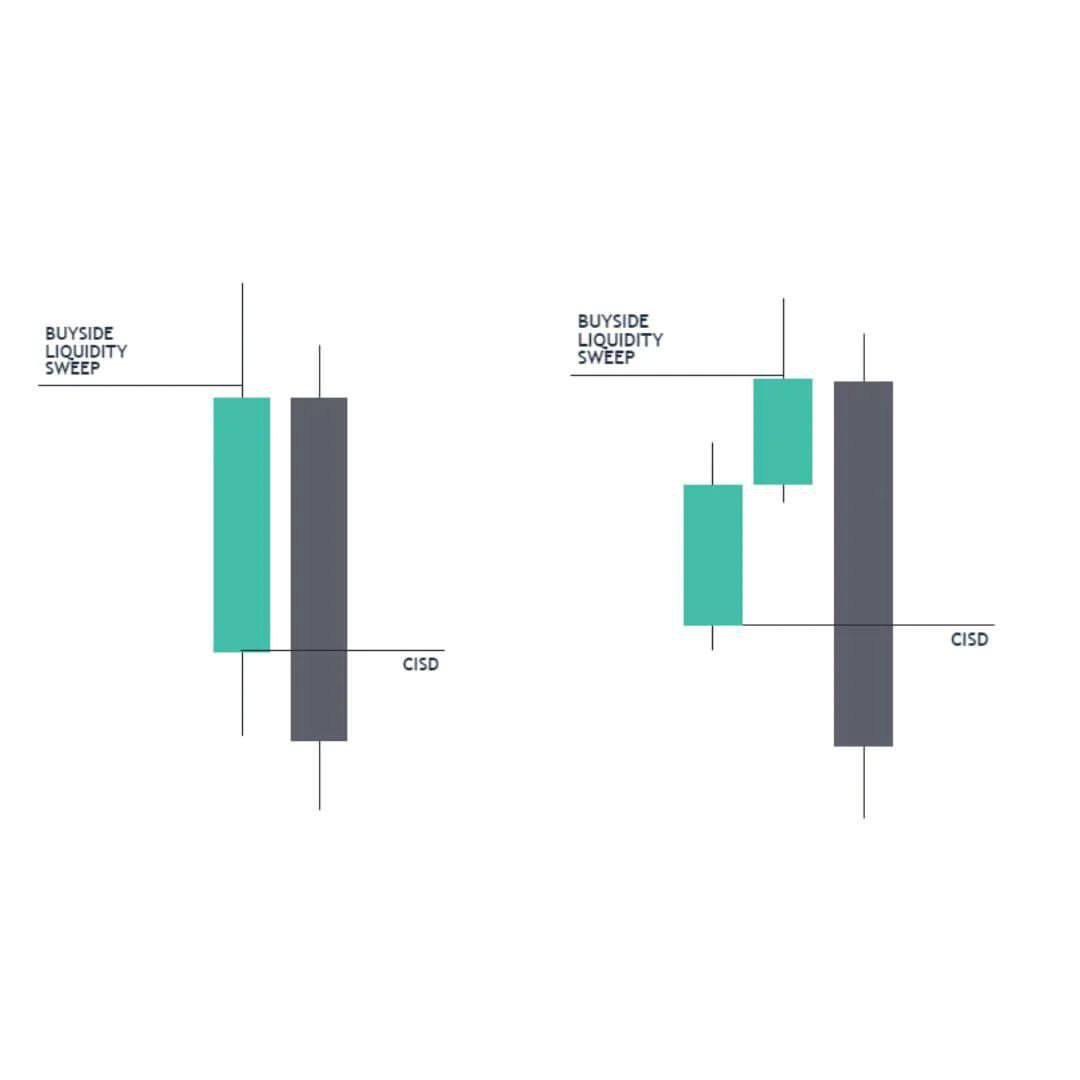
2.1 CISD
CISD is used to identify potential changes in market direction by analyzing the closing price relative to the opening price of up candles.
It offers an early entry point compared to other confirmation methods.
CISD is used to identify potential changes in market direction by analyzing the closing price relative to the opening price of up candles.
It offers an early entry point compared to other confirmation methods.
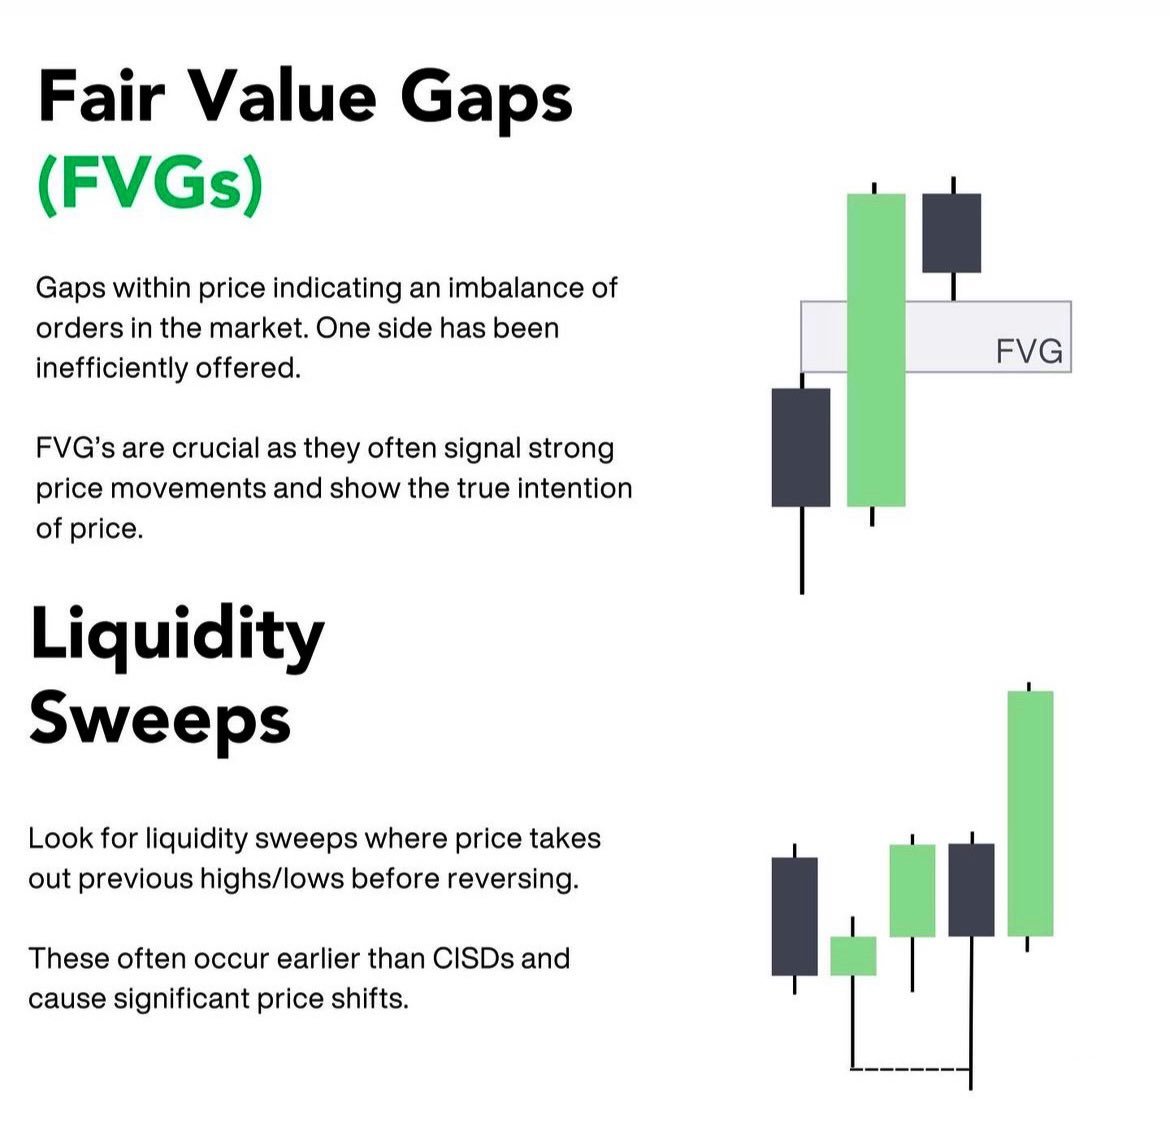
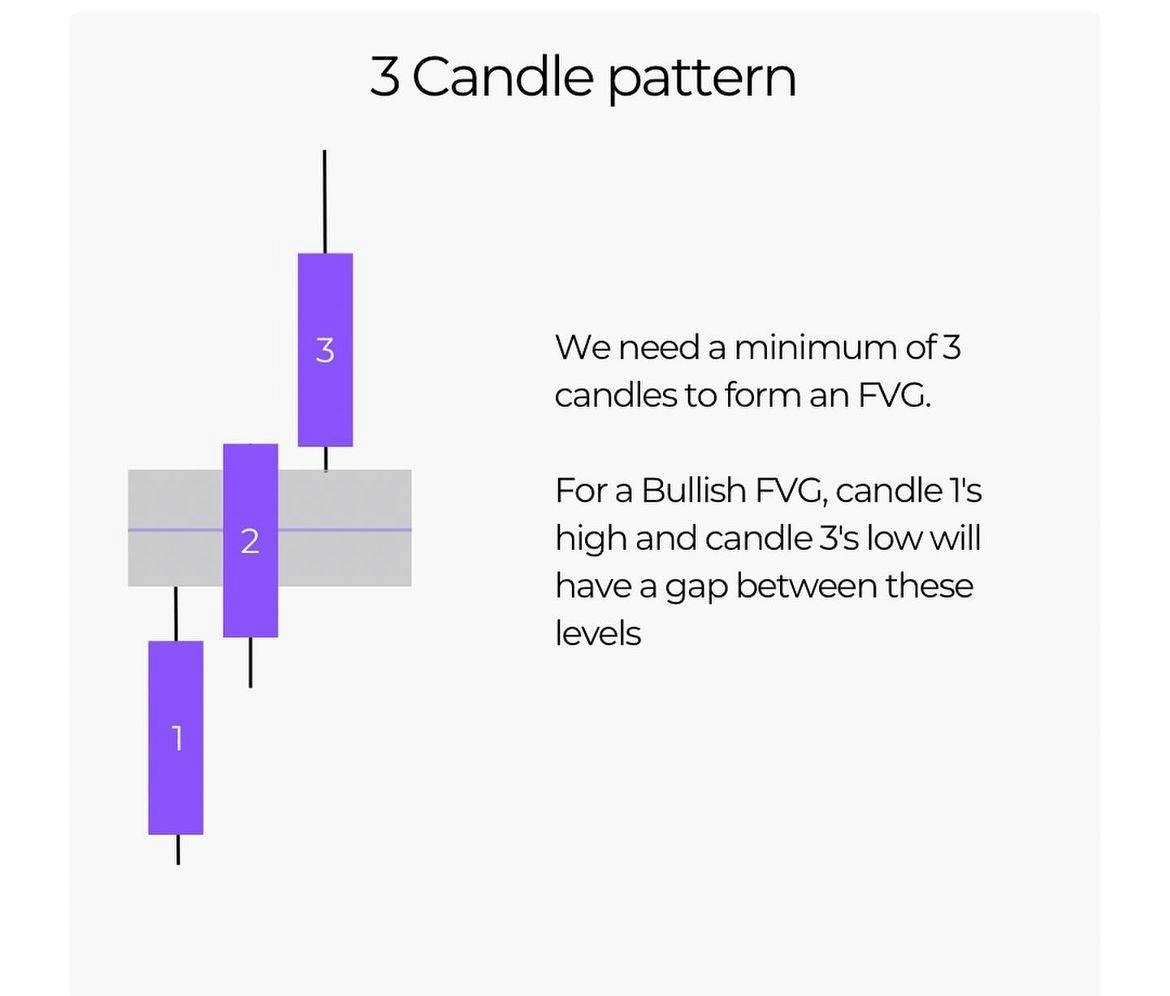
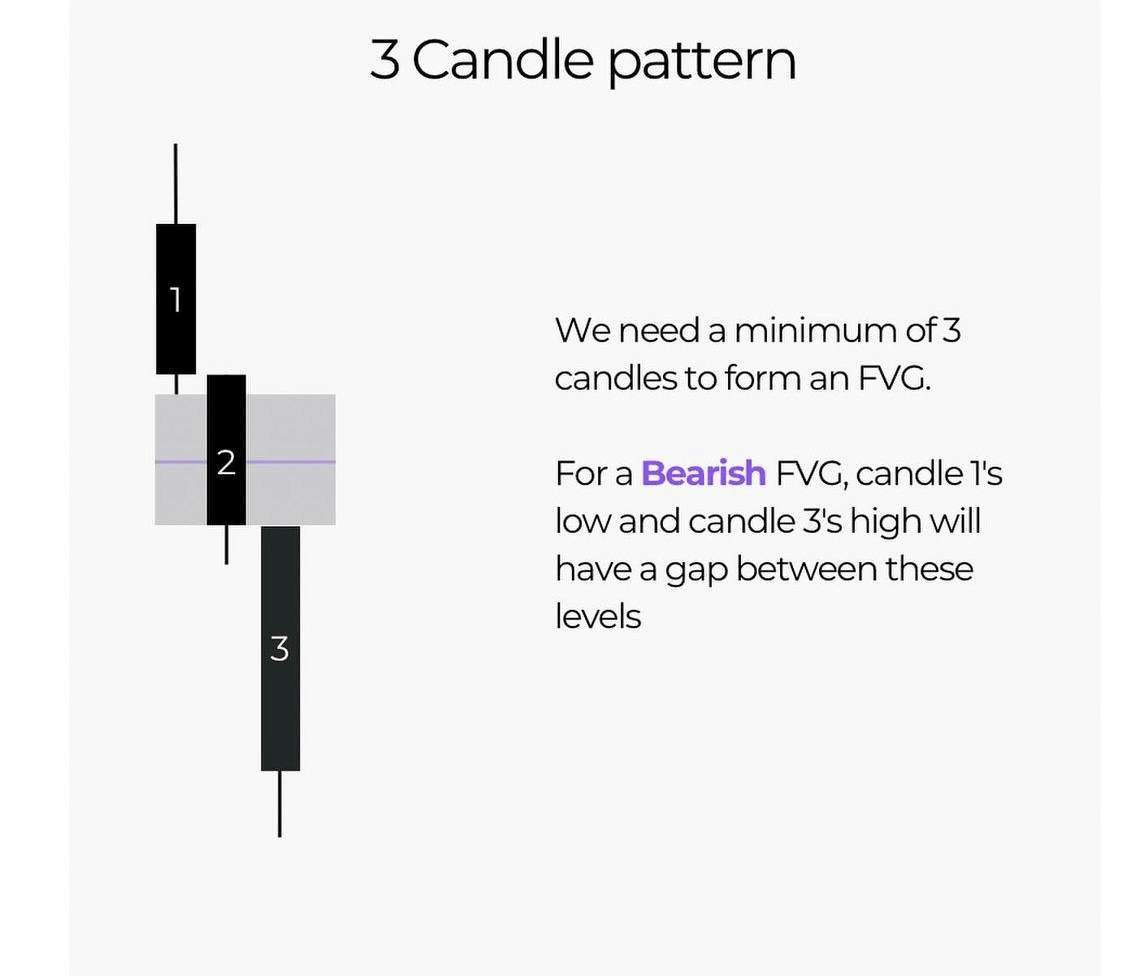
3. FVG's and Liquidity Sweeps
This is the formation of a BULLISH and BEARISH FVG.
You need to understand why FVG's are formed and where to trade them.
This is the formation of a BULLISH and BEARISH FVG.
You need to understand why FVG's are formed and where to trade them.
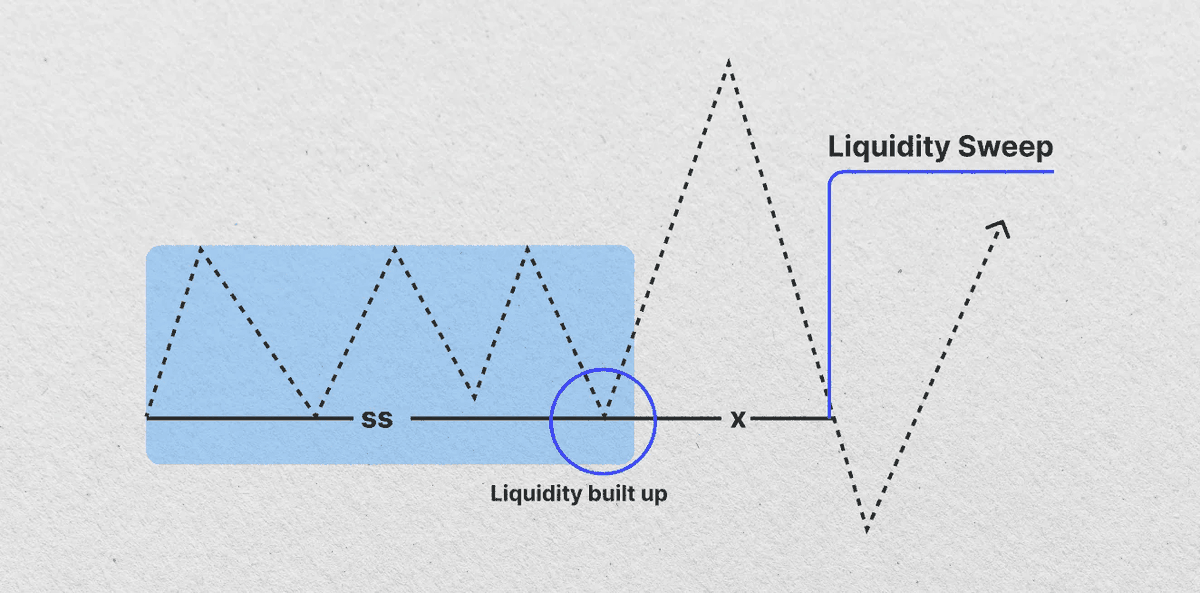
3.1 FVG's and Liquidity Sweeps
The term ‘liquidity sweep’ refers to the clearing of resting orders like a broom sweeping through an area
These sweeps are deliberately initiated by institutional players to ‘hunt’ for SL orders and fill their large orders at better prices
The term ‘liquidity sweep’ refers to the clearing of resting orders like a broom sweeping through an area
These sweeps are deliberately initiated by institutional players to ‘hunt’ for SL orders and fill their large orders at better prices
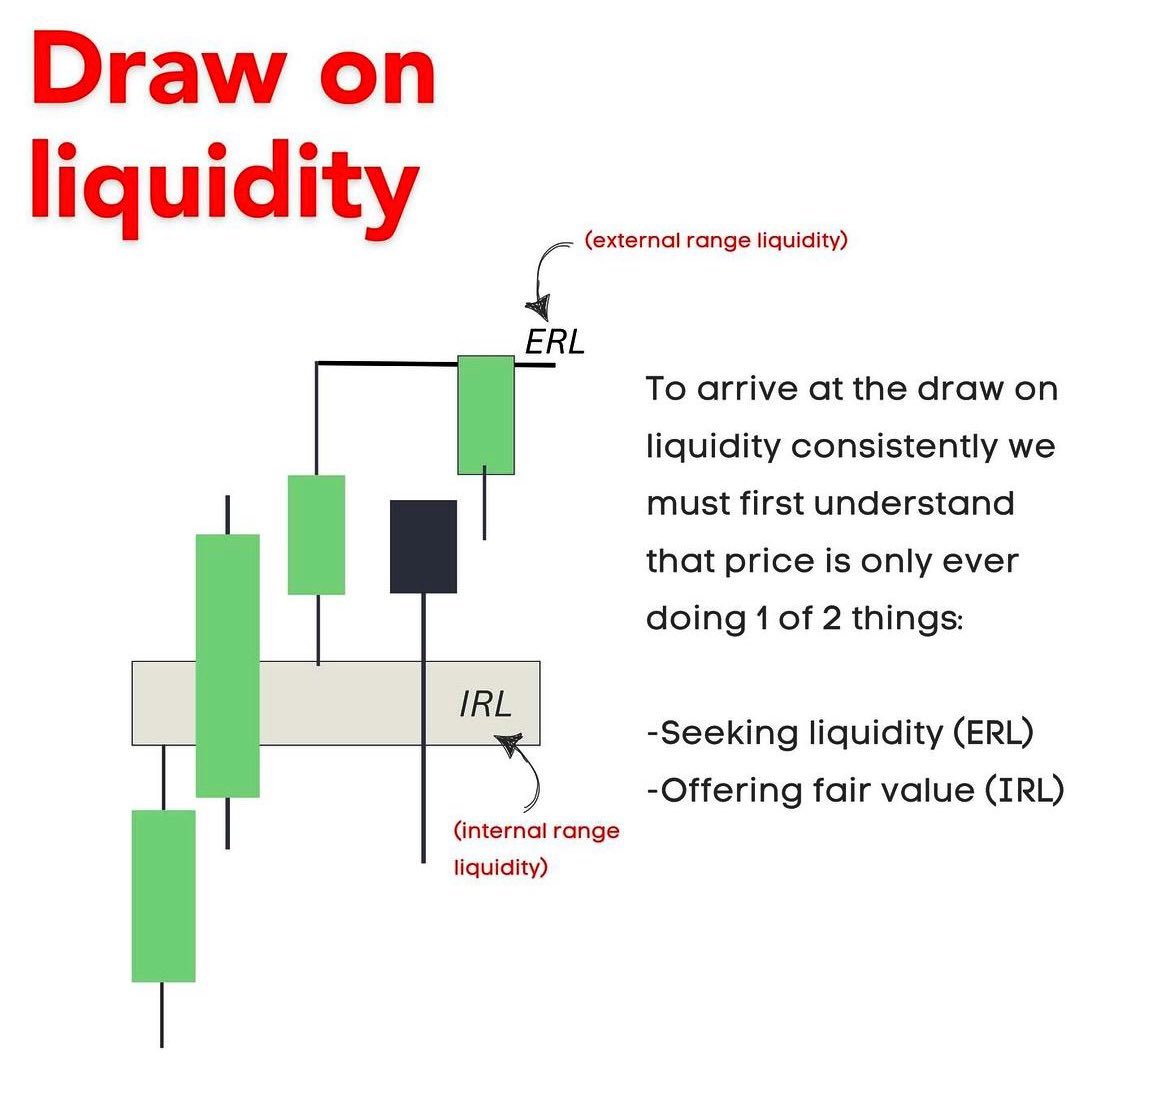
4. Draw on Liquidity
Drawing on liquidity means executing trades by utilizing the available liquidity in the market.
This is done by tapping into multiple liquidity providers to execute trades.
Drawing on liquidity means executing trades by utilizing the available liquidity in the market.
This is done by tapping into multiple liquidity providers to execute trades.

Loading suggestions...