

Most people have difficulty understanding volume analysis but you need not be one of them.
Learning about volumes is actually simple. Let us see how to use it to identify big moves.
(1/n)
Learning about volumes is actually simple. Let us see how to use it to identify big moves.
(1/n)
This is intraday chart of Nifty with 1 volume profile for every 1 hr till noon. Helps me identify potential big moves in 2nd half.
(2/n)
(2/n)
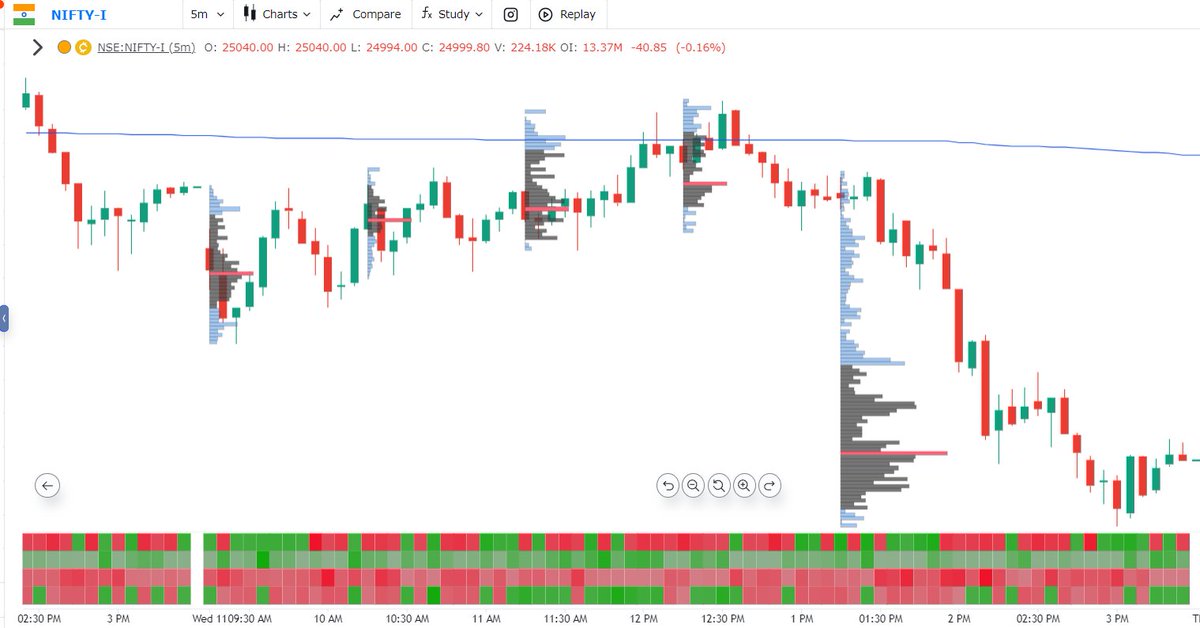
Nifty kept making higher highs but POC stopped climbing much higher. This indicates bulls were getting weaker.
(3/n)
(3/n)

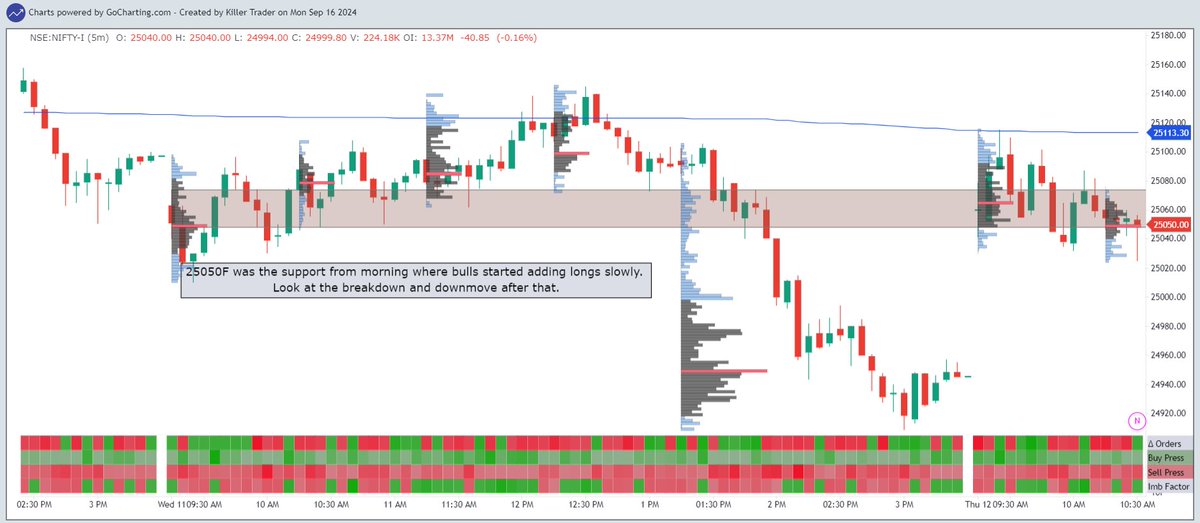
Next day, you can see how POC hardly moved lower in every period. For 4 hours, we saw huge volume build up and then a breakout.
These are the kind of breakouts that should give confidence to enter.
(4/n)
These are the kind of breakouts that should give confidence to enter.
(4/n)

In this case, we saw 100 pts downmove at open. But the period POC never moved lower. Inspite of all the selling, it stayed up.
First indication new shorts risk reward was bad and sellers at high will be challenged.
(5/n)
First indication new shorts risk reward was bad and sellers at high will be challenged.
(5/n)
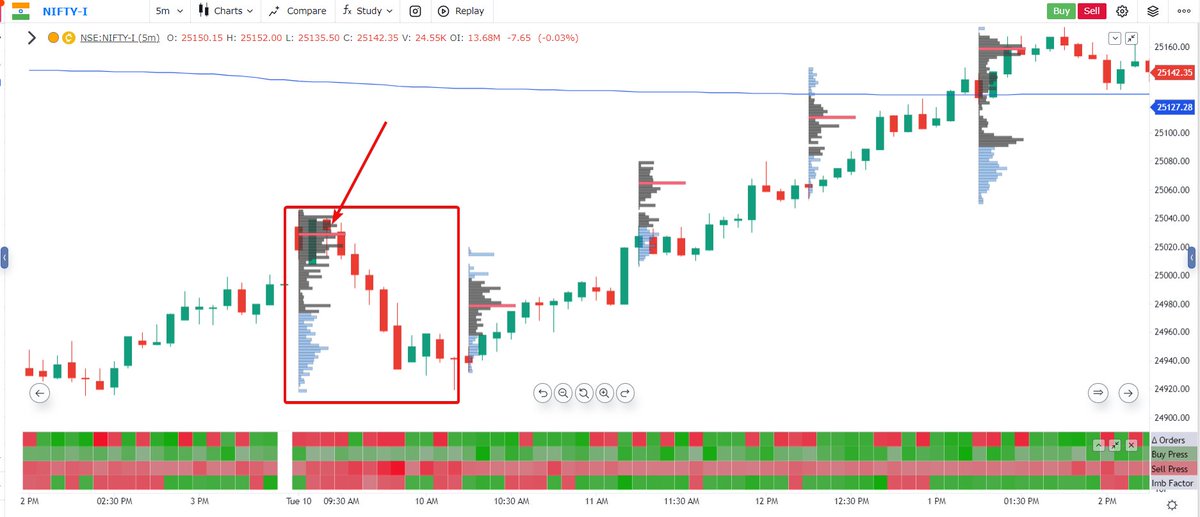
In 2nd period, we saw balanced auction. 3rd period showed strongest buyers as close > 1st period POC.
Such simple tricks help us understand if we can expect a big move, if the trend can continue strong or not.
Always, remember, context is the king.
(6/n)
Such simple tricks help us understand if we can expect a big move, if the trend can continue strong or not.
Always, remember, context is the king.
(6/n)

That's a wrap!
If you enjoyed this thread:
1. Follow me @KillerTrader_ for more of these
2. RT the tweet below to share this thread with your audience
3. Charts powered @gocharting
If you enjoyed this thread:
1. Follow me @KillerTrader_ for more of these
2. RT the tweet below to share this thread with your audience
3. Charts powered @gocharting
If you are a serious trader and want to learn how volume analysis works, check out my community: t.me

Loading suggestions...