

In this THREAD I will explain "Price Action"
1. Supply and Demand
2. Breakout and Retest
3. Trendlines
4. Orderblock
🧵(1/12) x.com
1. Supply and Demand
2. Breakout and Retest
3. Trendlines
4. Orderblock
🧵(1/12) x.com
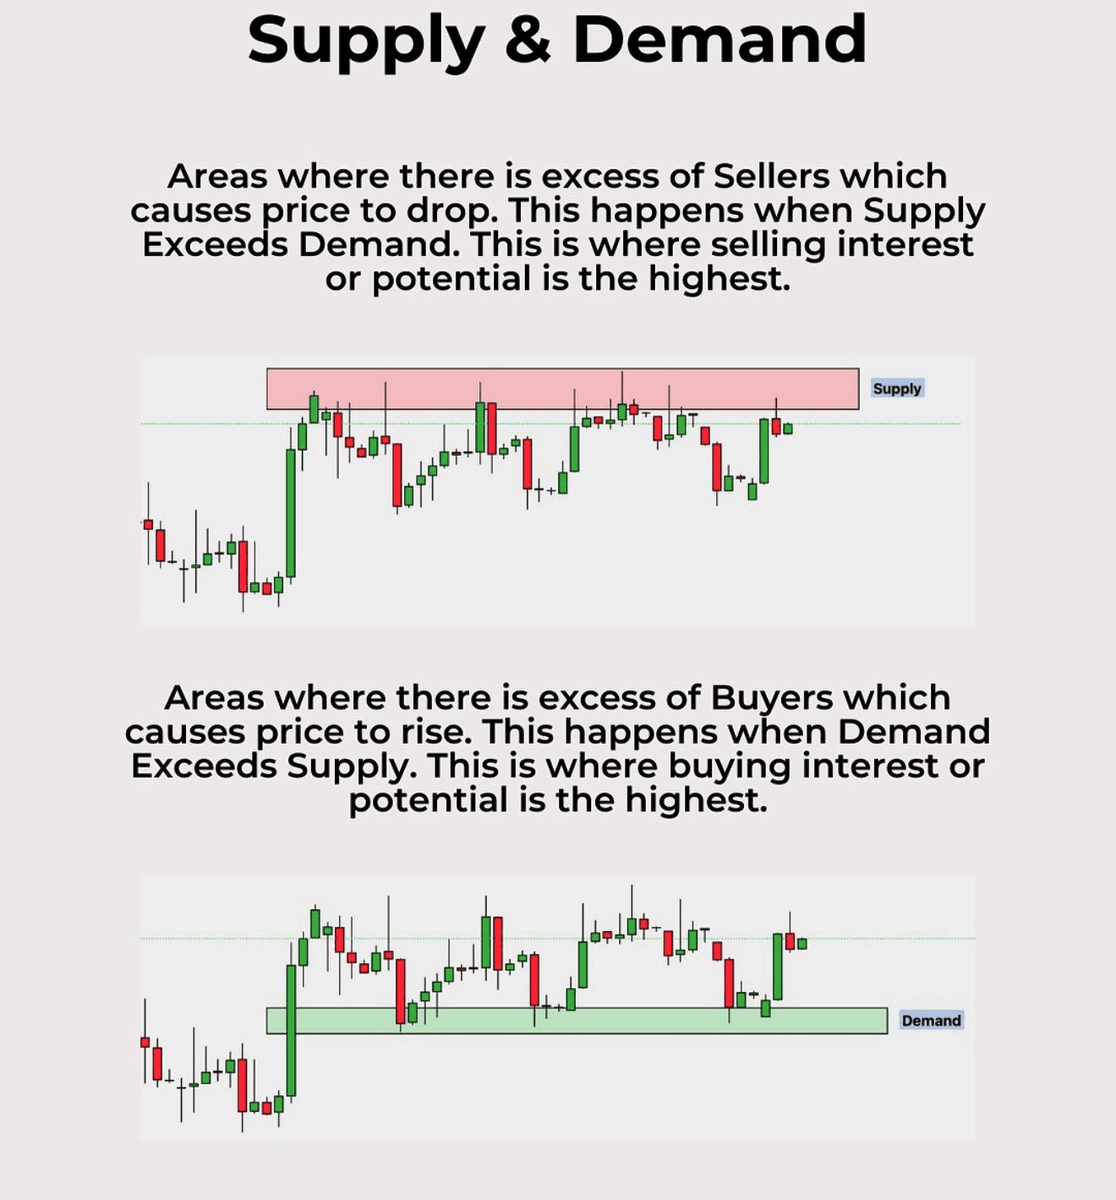
1. Supply and Demand
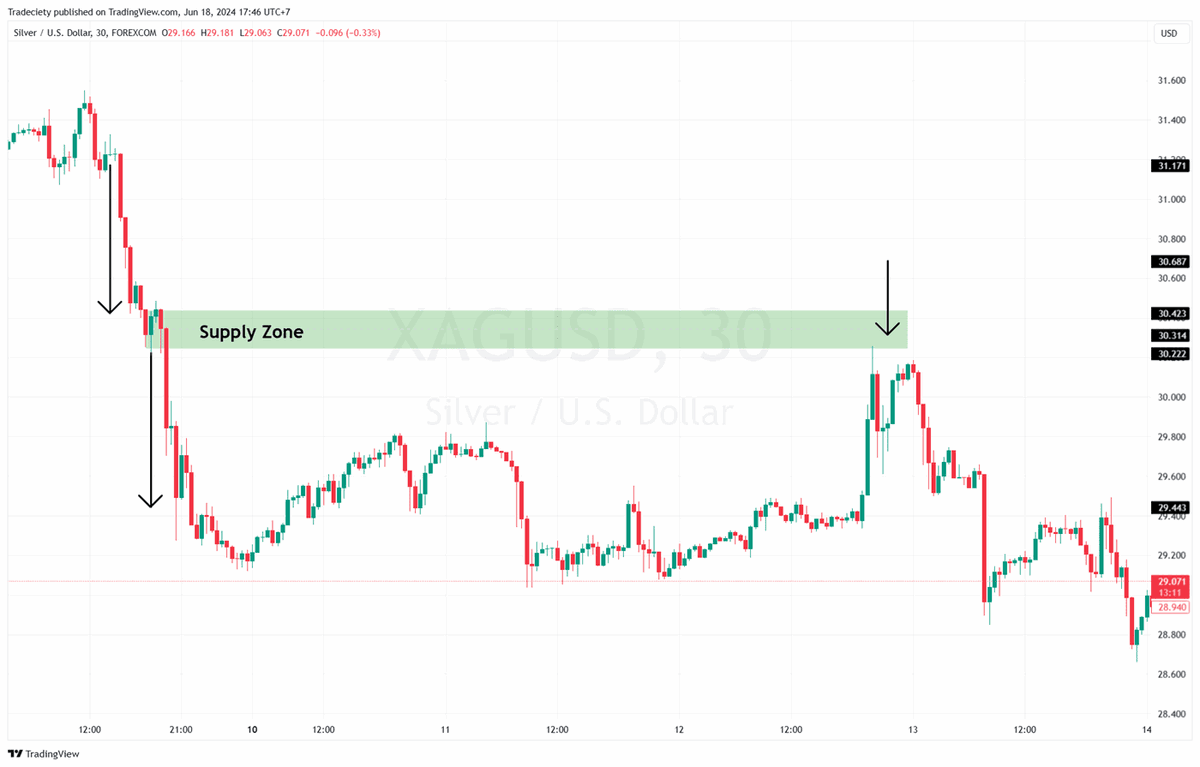
In a Supply zone, there is an excess of sellers, causing the price to drop. This occurs when supply exceeds demand.
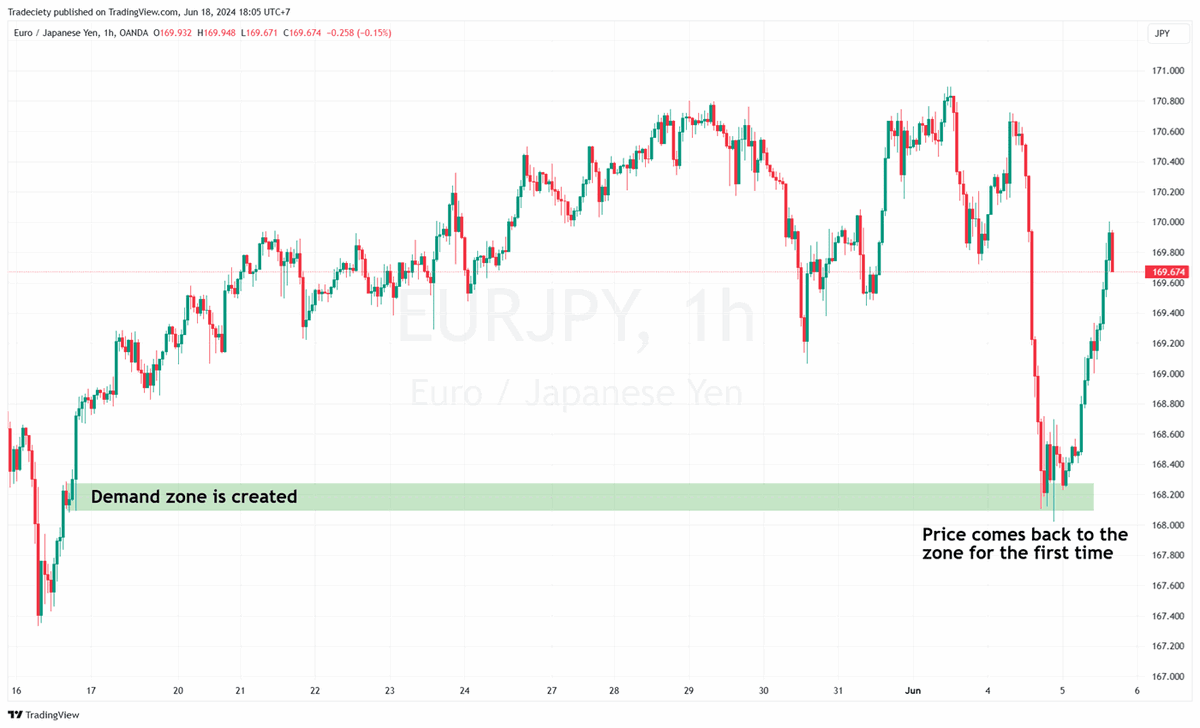
In a Demand zone, there is an excess of buyers, causing the price to rise. This occurs when demand exceeds supply. x.com
In a Supply zone, there is an excess of sellers, causing the price to drop. This occurs when supply exceeds demand.
In a Demand zone, there is an excess of buyers, causing the price to rise. This occurs when demand exceeds supply. x.com
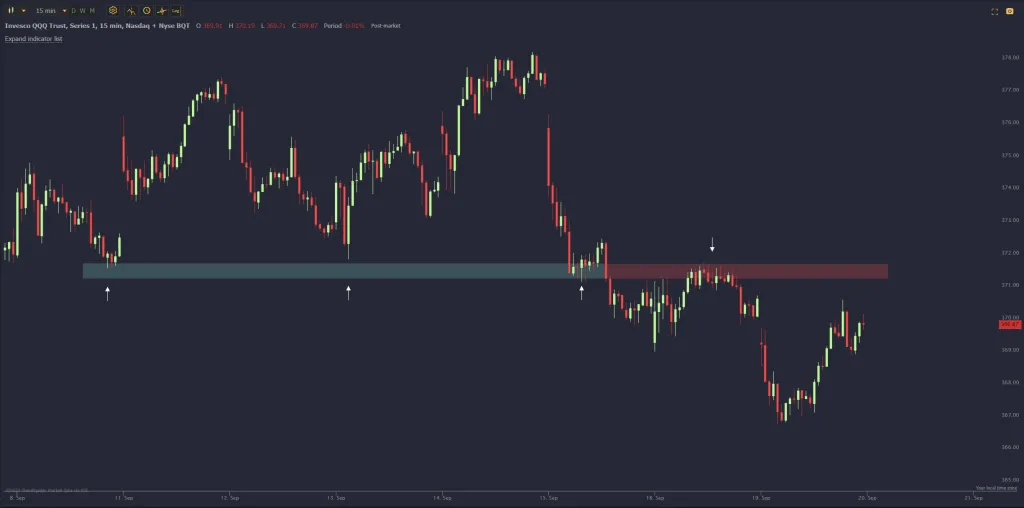
1.1 Supply and Demand
Identifying Supply and Demand zones is important because they can indicate potential areas of Support or Resistance
- Look for areas where the price has stalled or reversed
- Identify price levels where the price has reversed multiple times x.com
Identifying Supply and Demand zones is important because they can indicate potential areas of Support or Resistance
- Look for areas where the price has stalled or reversed
- Identify price levels where the price has reversed multiple times x.com
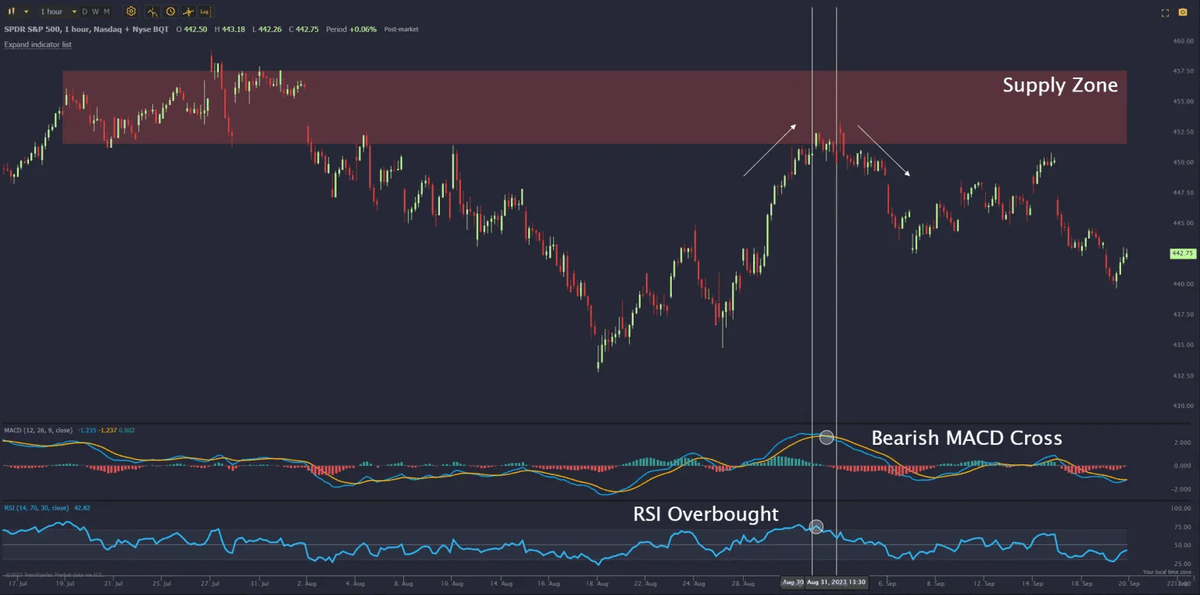
1.2 Supply and Demand
When you are identifying Supply and Demand, this will help:
- Look for high-volume areas: This will indicate a concentration of buying or selling pressure
- Use technical indicators to confirm your confluence. For example : MACD, RSI, CVD x.com
When you are identifying Supply and Demand, this will help:
- Look for high-volume areas: This will indicate a concentration of buying or selling pressure
- Use technical indicators to confirm your confluence. For example : MACD, RSI, CVD x.com
1.3 Supply and Demand
The price will always seek for liquidity as you can see in the shared charts.
Supply and Demand zones are very useful when entering and exiting a position.
The price will look for these liquidity zones to bounce or reverse. x.com
The price will always seek for liquidity as you can see in the shared charts.
Supply and Demand zones are very useful when entering and exiting a position.
The price will look for these liquidity zones to bounce or reverse. x.com
2. Breakout and Retest
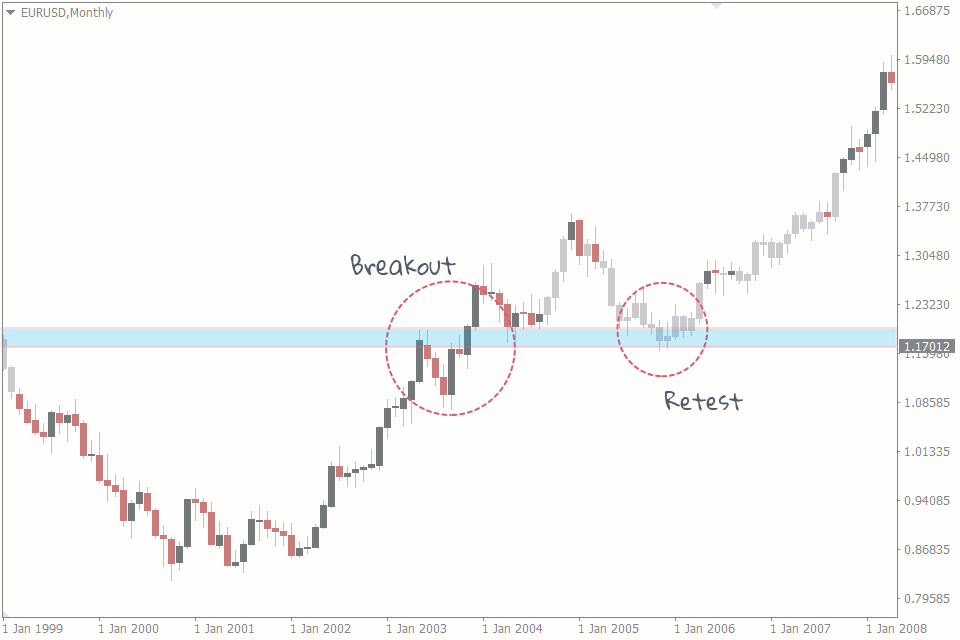
The break and retest strategy involves identifying key levels, waiting for a breakout, and then strategically entering the market during the retest phase.
- Identify consolidation
- Wait for a breakout and retest
- Enter the trade and set TP and SL x.com
The break and retest strategy involves identifying key levels, waiting for a breakout, and then strategically entering the market during the retest phase.
- Identify consolidation
- Wait for a breakout and retest
- Enter the trade and set TP and SL x.com
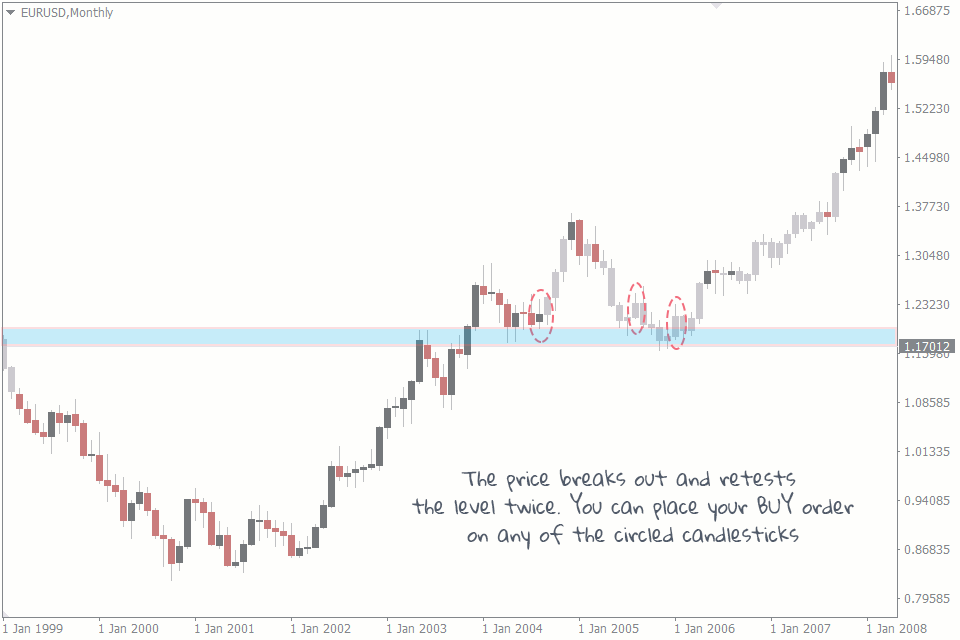
2.1 Breakout and retest
How to trade it:
- Confirm that the breakout aligns with the prevailing trend
- Lower volume on the retest compared to the breakout = new level is holding.
High volume on the breakout = strength
- Wait for the candle at the retest to close x.com
How to trade it:
- Confirm that the breakout aligns with the prevailing trend
- Lower volume on the retest compared to the breakout = new level is holding.
High volume on the breakout = strength
- Wait for the candle at the retest to close x.com
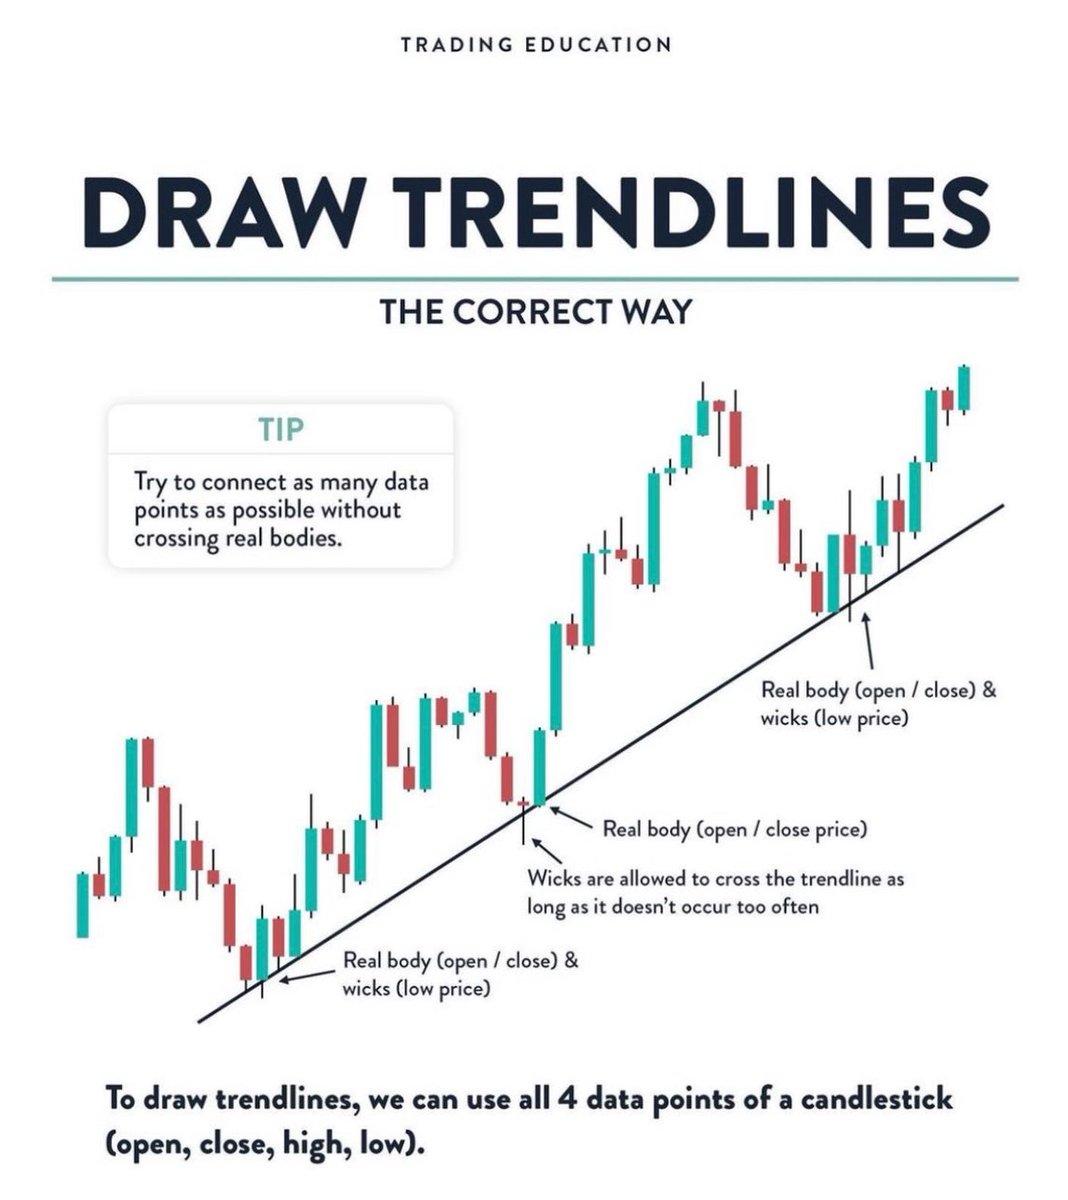
3. Trendlines
Trendlines are one of the most basic tools in TA.
Trendlines connect a series of price together, and give a good idea of the direction of price movement, as well as possible entry and exit points. x.com
Trendlines are one of the most basic tools in TA.
Trendlines connect a series of price together, and give a good idea of the direction of price movement, as well as possible entry and exit points. x.com
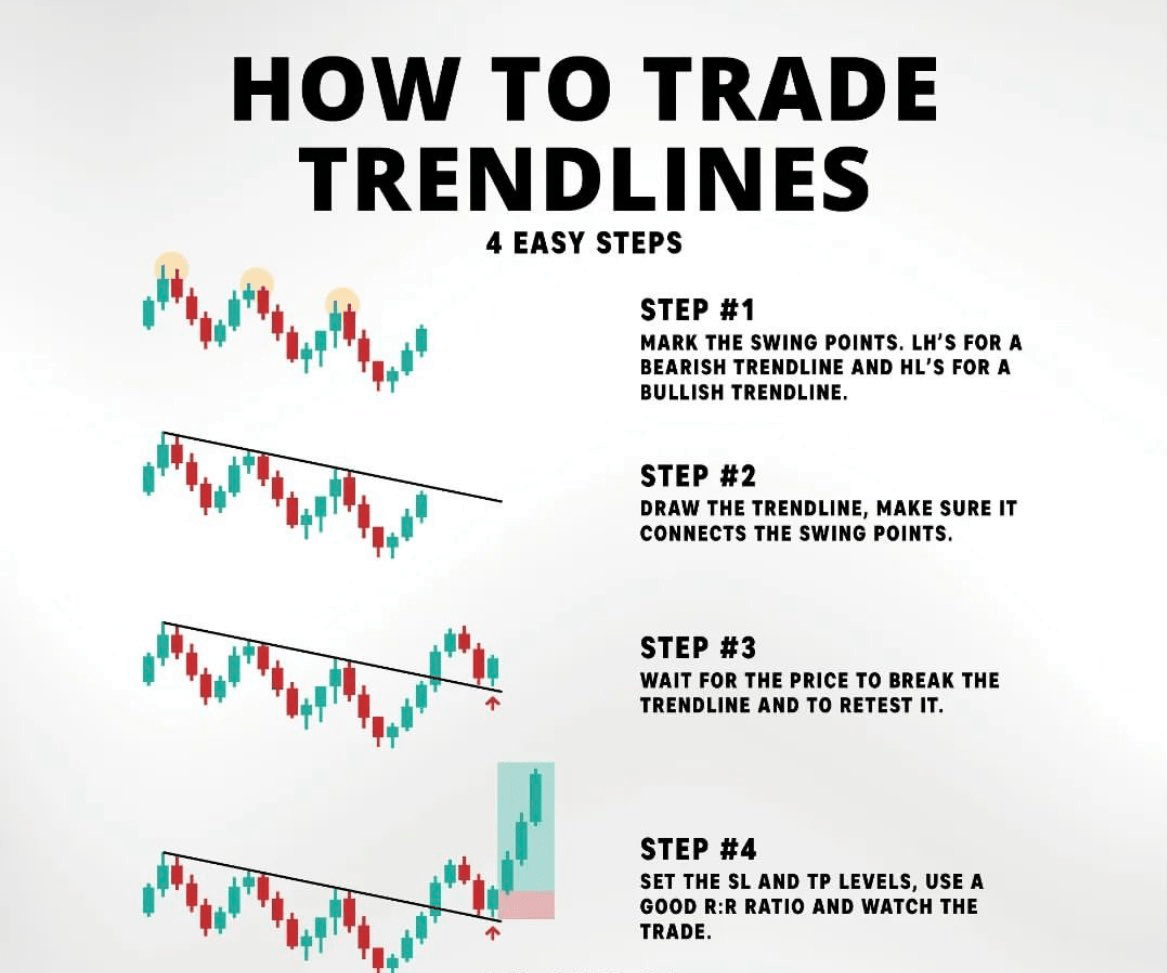
3.1 Trendlines
How to trade Trendlines:
1. Mark the swing points. LH's for a bearish trendline and HL's for a bullish trendline
2. Draw the trendline. Connect the swing points
3. Wait for a break out of that resistance and a retest of the trendline
4. Set SL and TP x.com
How to trade Trendlines:
1. Mark the swing points. LH's for a bearish trendline and HL's for a bullish trendline
2. Draw the trendline. Connect the swing points
3. Wait for a break out of that resistance and a retest of the trendline
4. Set SL and TP x.com
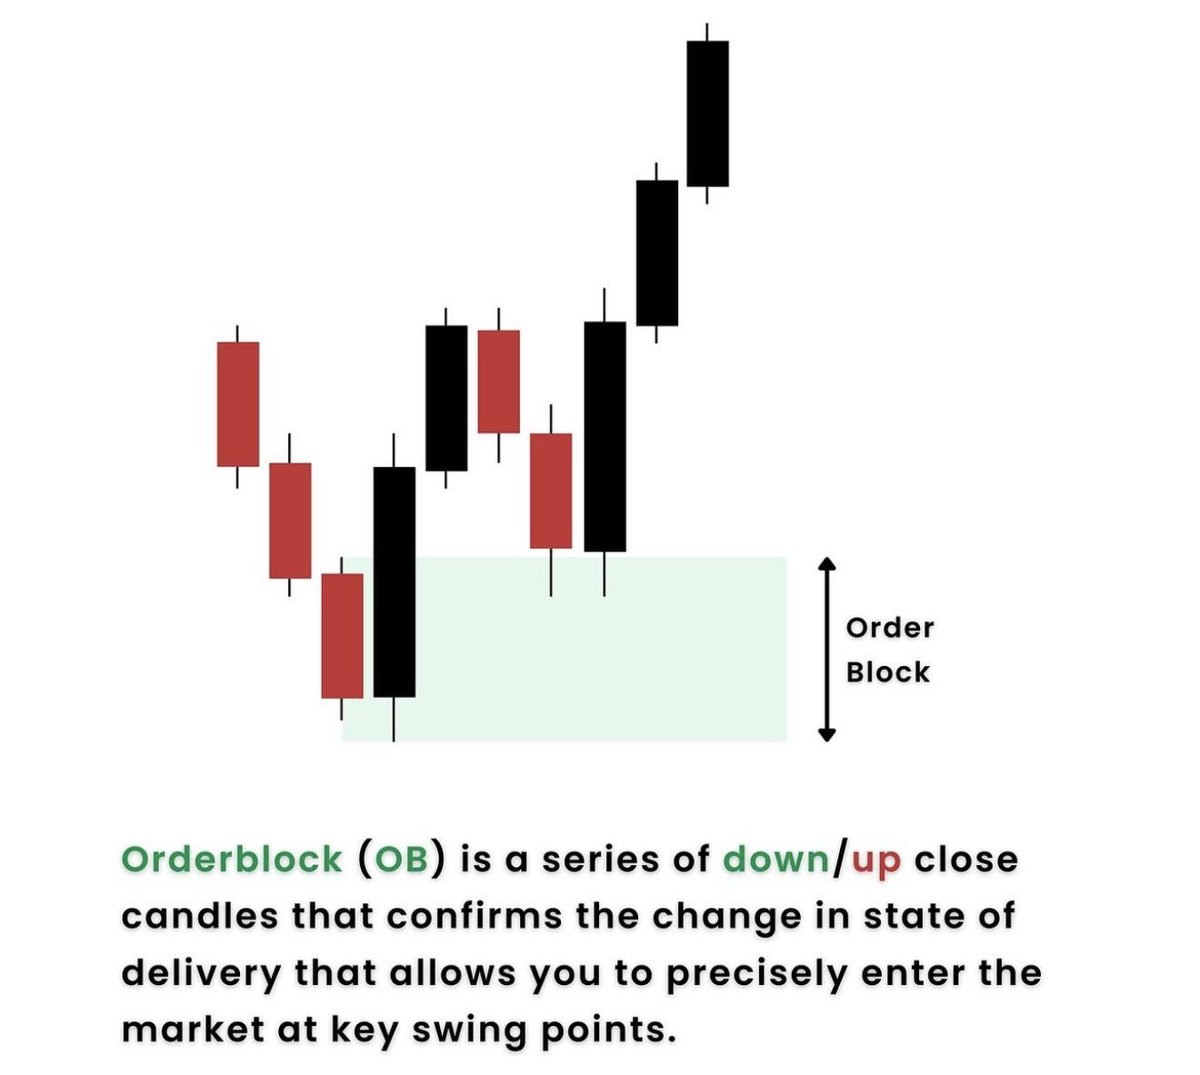
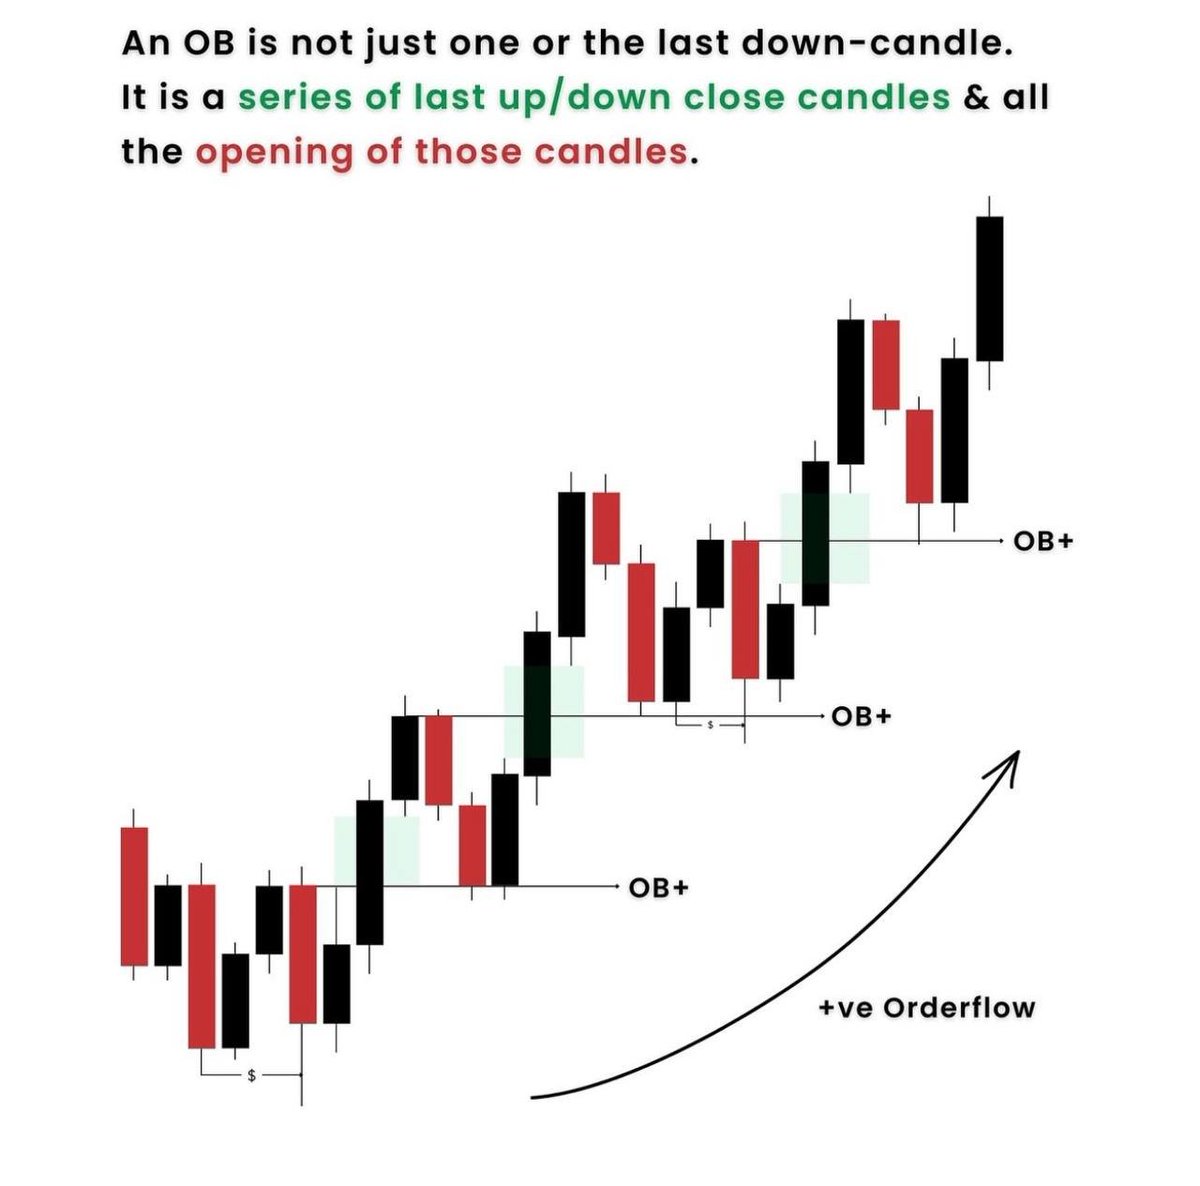
4. Orderblock
An order block is where institutional traders have placed large orders, leading to potential price reversals or continuations.
A rejection block, occurs when the price attempts to move through an order block but fails x.com
An order block is where institutional traders have placed large orders, leading to potential price reversals or continuations.
A rejection block, occurs when the price attempts to move through an order block but fails x.com
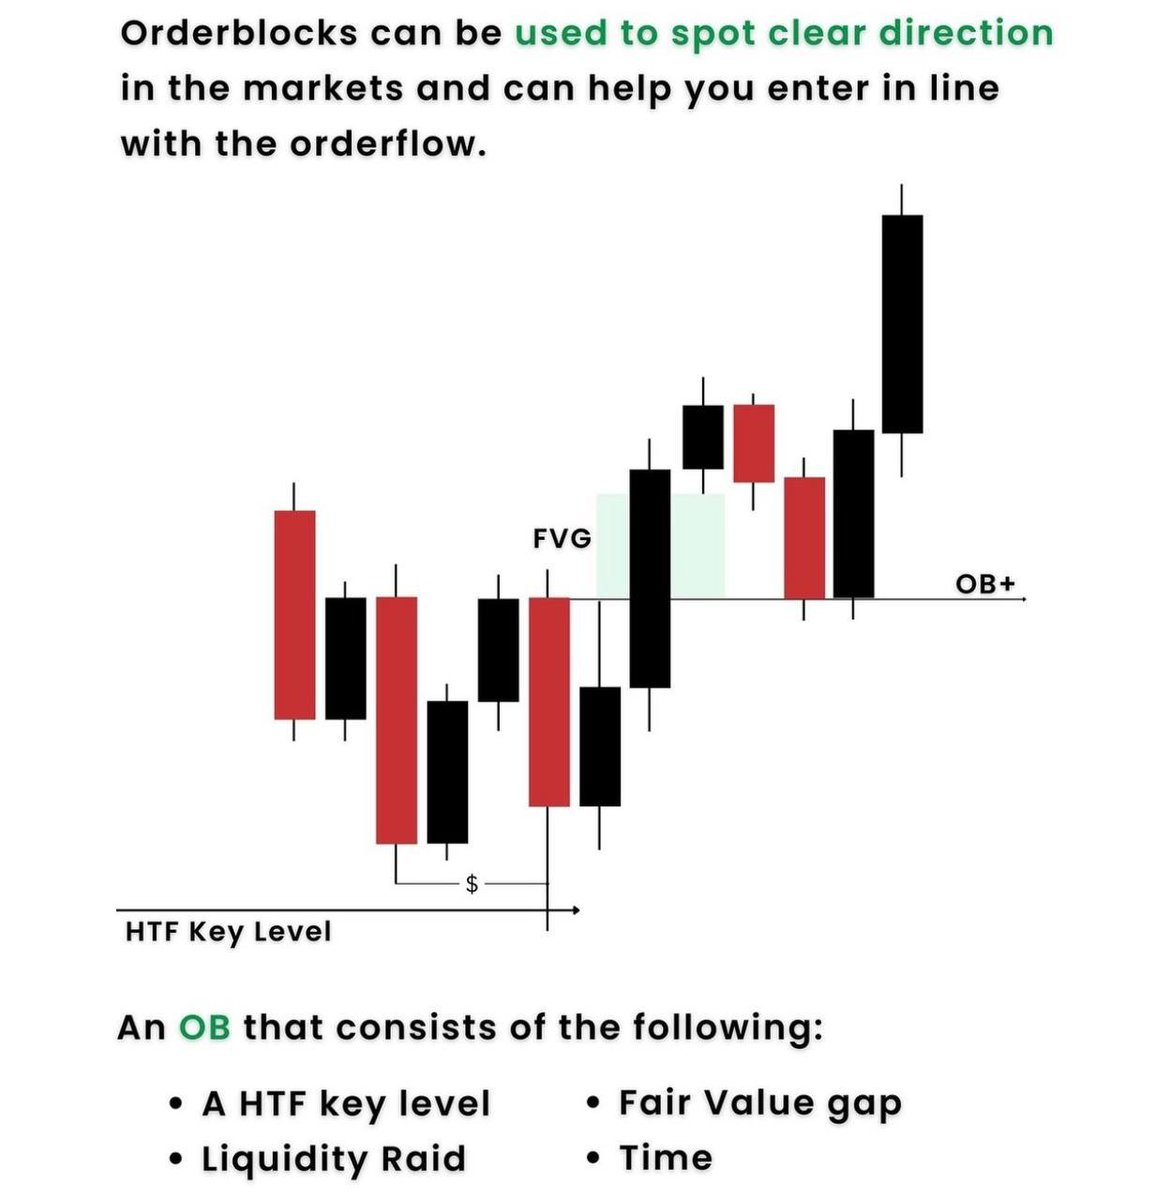
4.1 Orderblock
OB are used to identify the trend in the PA, and help you enter the trader with the orderflow.
An OB refers to a zone where there has been a large accumulation of buy or sell orders
These zones often act as key support or resistance levels later on x.com
OB are used to identify the trend in the PA, and help you enter the trader with the orderflow.
An OB refers to a zone where there has been a large accumulation of buy or sell orders
These zones often act as key support or resistance levels later on x.com
4.2 Orderblock
Use several timeframes to identify Orderblocks.
Use Higher Timeframes such as Daily and 4H.
Confirm if the trend prevails in 1H for entering a trade. x.com
Use several timeframes to identify Orderblocks.
Use Higher Timeframes such as Daily and 4H.
Confirm if the trend prevails in 1H for entering a trade. x.com
Loading suggestions...