

In this THREAD I will explain “Liquidity”
1. Where is the Liquidity?
2. Liquidation Heatmap
3. Liquidation Levels
4. Order Block
🧵(1/15) x.com
1. Where is the Liquidity?
2. Liquidation Heatmap
3. Liquidation Levels
4. Order Block
🧵(1/15) x.com

1. Where is the Liquidity?
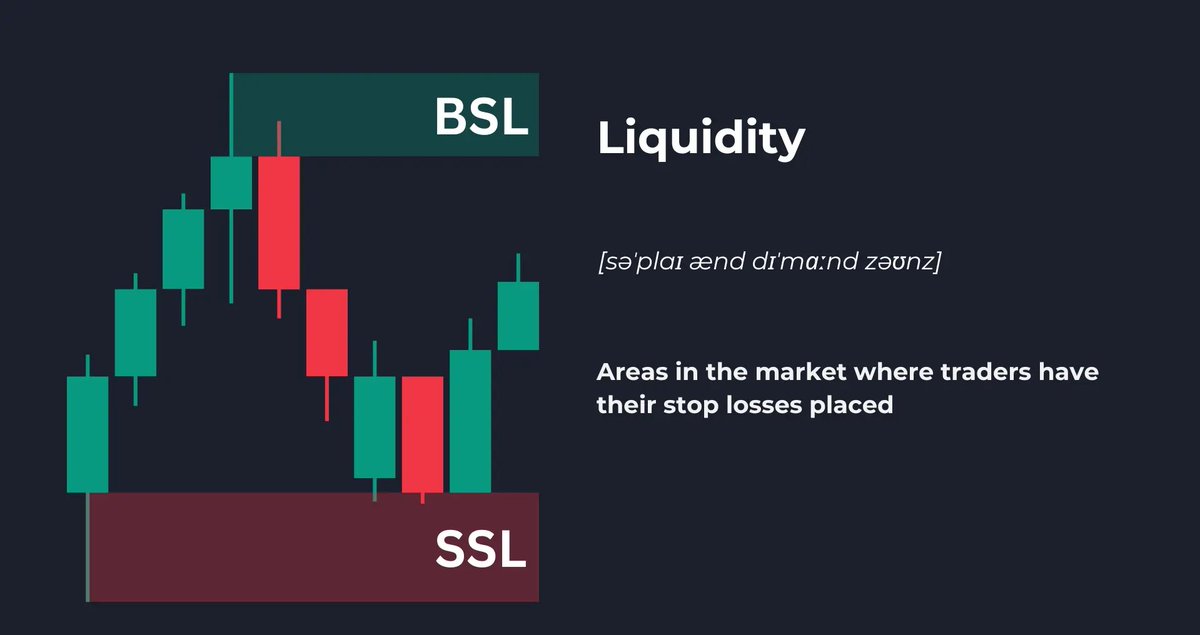
There are 2 types of Liquidity:
Buyside Liquidity (BSL) refers to the levels on the chart where short sellers have their stop losses set.
While Sellside Liquidity (SSL) refers to the levels where traders who are long have their stop losses set. x.com
There are 2 types of Liquidity:
Buyside Liquidity (BSL) refers to the levels on the chart where short sellers have their stop losses set.
While Sellside Liquidity (SSL) refers to the levels where traders who are long have their stop losses set. x.com
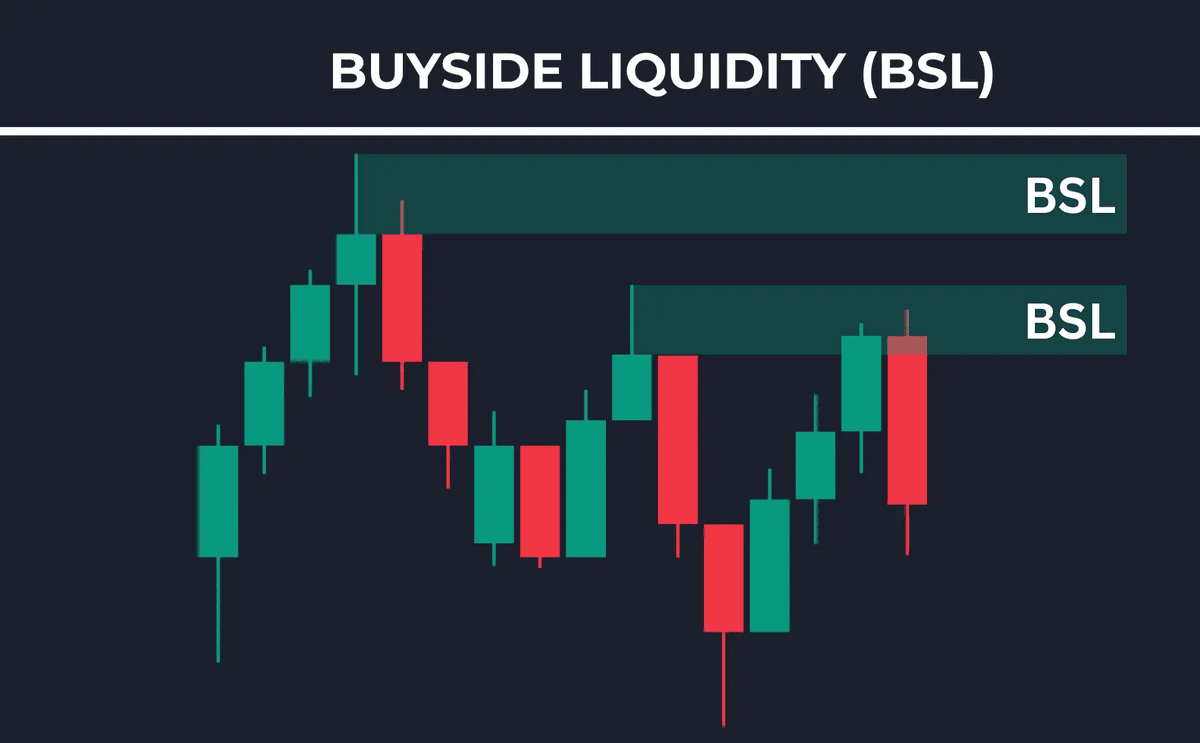
1.1 Where is the Liquidity?
BSL refers to the price levels where a large amount of pending buy orders are placed.
These orders are placed by short sellers at their SL in order to close out their short positions. x.com
BSL refers to the price levels where a large amount of pending buy orders are placed.
These orders are placed by short sellers at their SL in order to close out their short positions. x.com
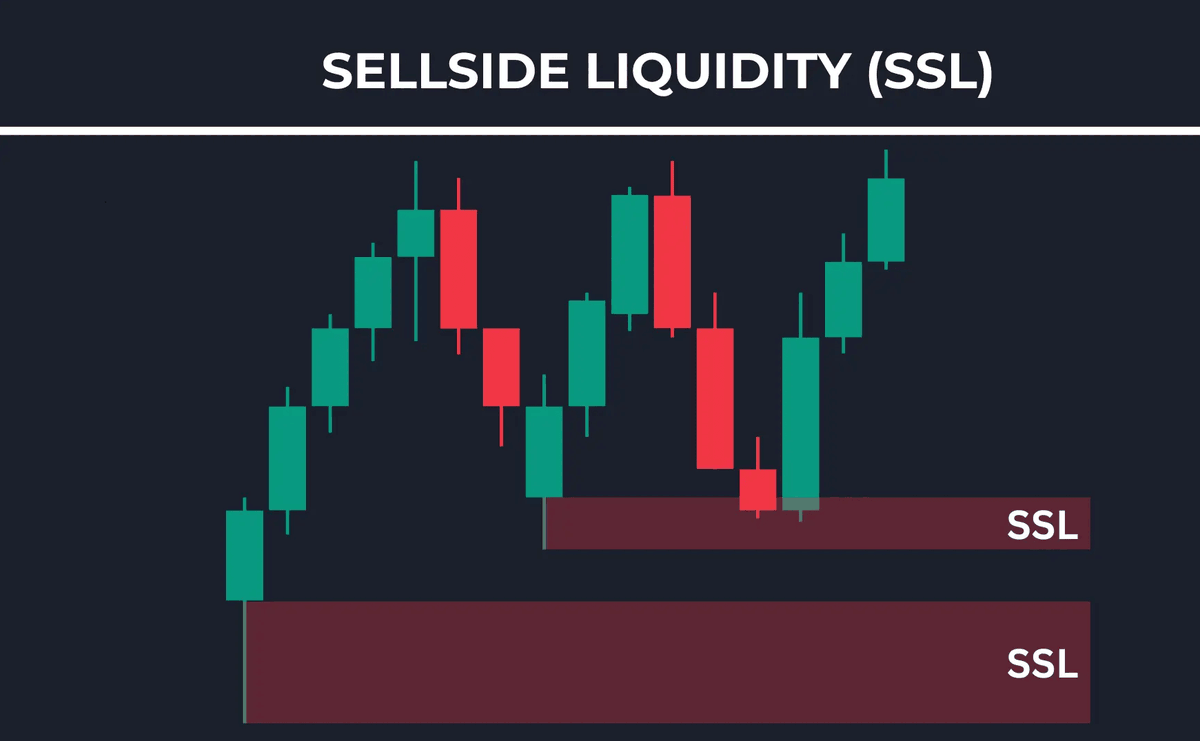
1.2 Where is the Liquidity?
SSL refers to the price levels where a large amount of pending sell orders are placed.
These orders are placed by long-biased traders as their stop loss in order to close out their long positions. x.com
SSL refers to the price levels where a large amount of pending sell orders are placed.
These orders are placed by long-biased traders as their stop loss in order to close out their long positions. x.com
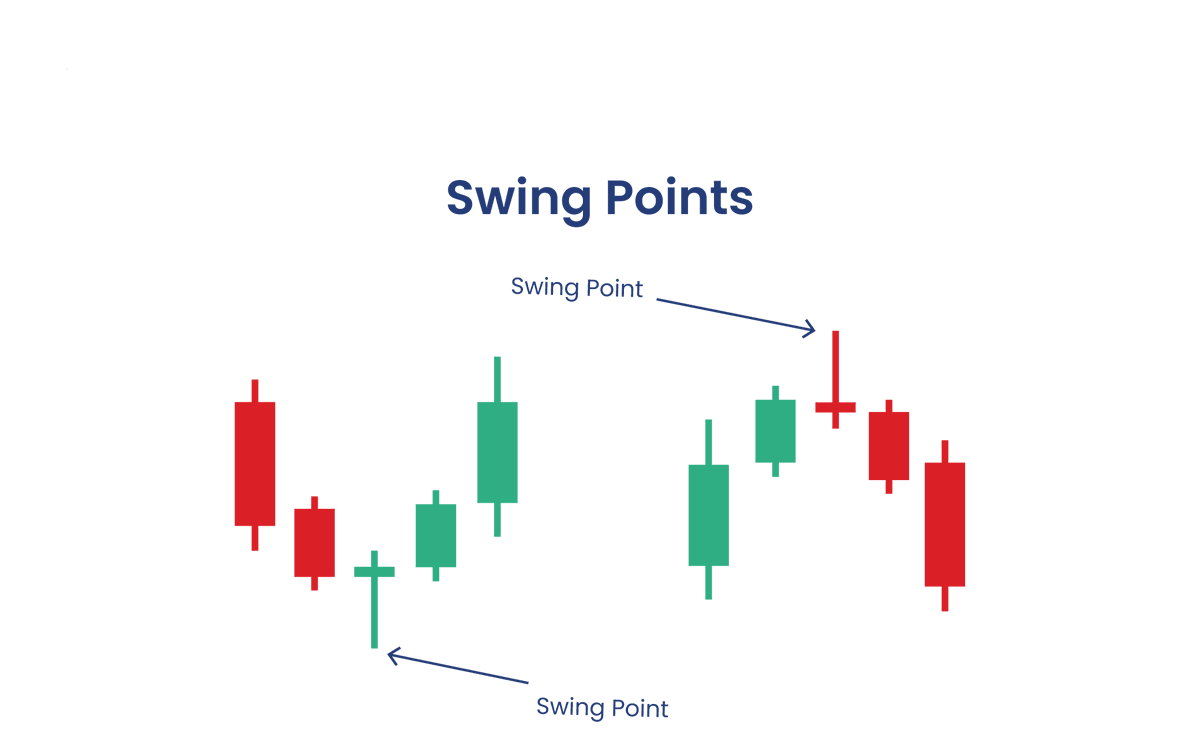
1.3 Where is the Liquidity?
A swing high is a peak formed when the price moves upward and then reverses direction.
A swing low is a trough where the price declines and then reverses upward.
Recognizing these points will help you understand the current trend x.com
A swing high is a peak formed when the price moves upward and then reverses direction.
A swing low is a trough where the price declines and then reverses upward.
Recognizing these points will help you understand the current trend x.com
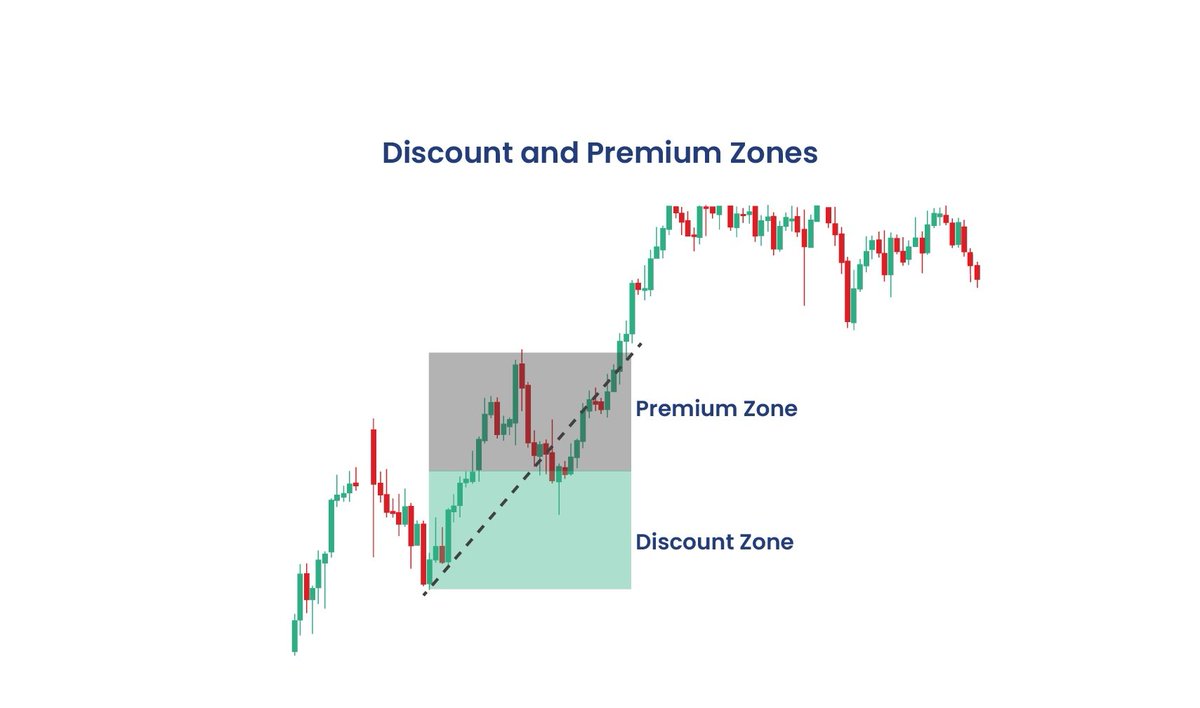
1.4 Where is the Liquidity?
Premium zones are areas above the equilibrium (midpoint) of a price range, where the asset is considered more expensive, ideal for selling.
Discount zones are below the equilibrium, where the asset is cheaper, ideal for buying. x.com
Premium zones are areas above the equilibrium (midpoint) of a price range, where the asset is considered more expensive, ideal for selling.
Discount zones are below the equilibrium, where the asset is cheaper, ideal for buying. x.com
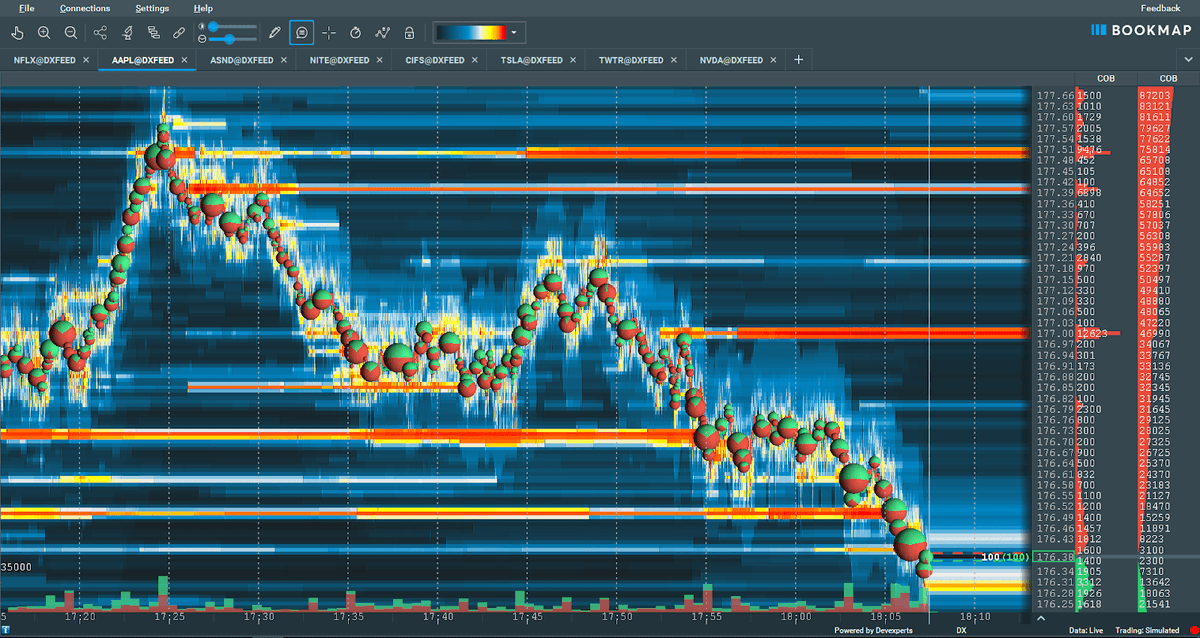
2. Liquidation Heatmap
The heatmap is a visual representation of the limit orders put into the order book.
Creating a futures heatmap that reveals hidden liquidity levels in the market.
On the right side of the vertical timeline is the current order book. x.com
The heatmap is a visual representation of the limit orders put into the order book.
Creating a futures heatmap that reveals hidden liquidity levels in the market.
On the right side of the vertical timeline is the current order book. x.com
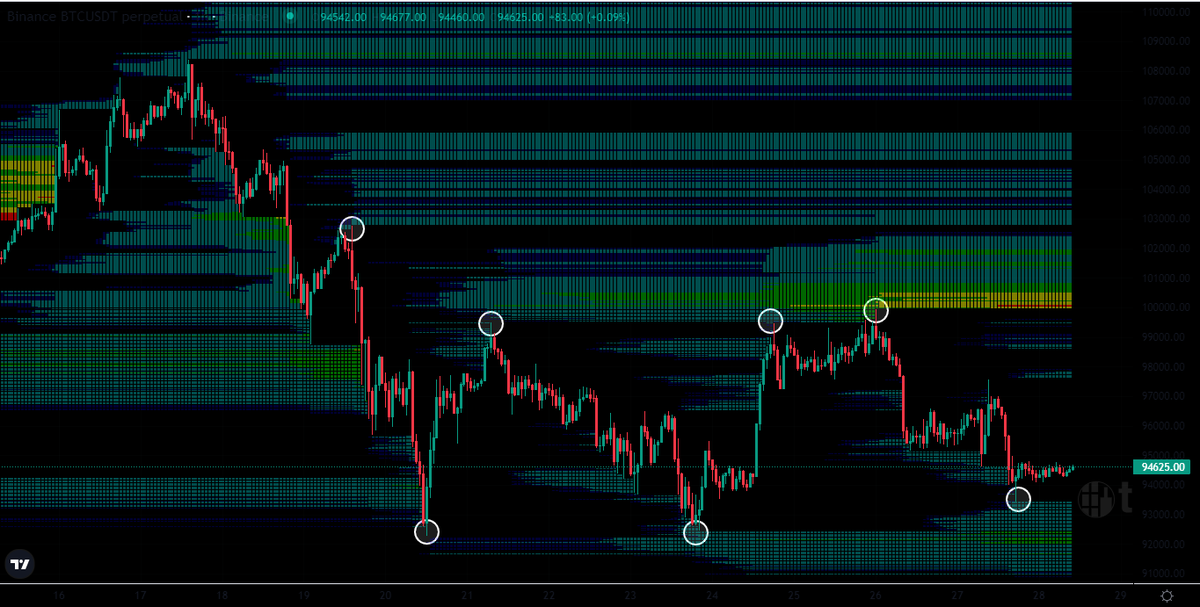
2.1 Liquidation Heatmap
A Liquidation Heatmap shows where liquidity is in the market.
And how liquidity providers behave on a given day, based on three parameters: color, brightness, and area
They are used to represent the distribution of liquidity and order flow. x.com
A Liquidation Heatmap shows where liquidity is in the market.
And how liquidity providers behave on a given day, based on three parameters: color, brightness, and area
They are used to represent the distribution of liquidity and order flow. x.com
3. Liquidation Levels
Liquidation Levels are estimates of potential price levels where liquidation events may occur.
By analyzing Liquidation Levels you can identify:
Support and Resistance levels, identify SL levels and gauge market sentiment x.com
Liquidation Levels are estimates of potential price levels where liquidation events may occur.
By analyzing Liquidation Levels you can identify:
Support and Resistance levels, identify SL levels and gauge market sentiment x.com
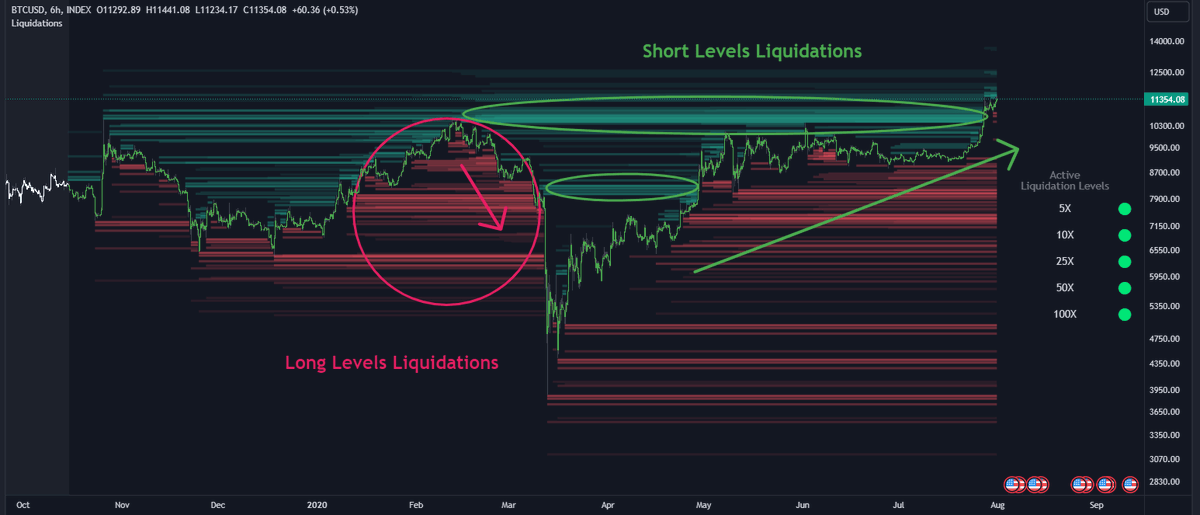
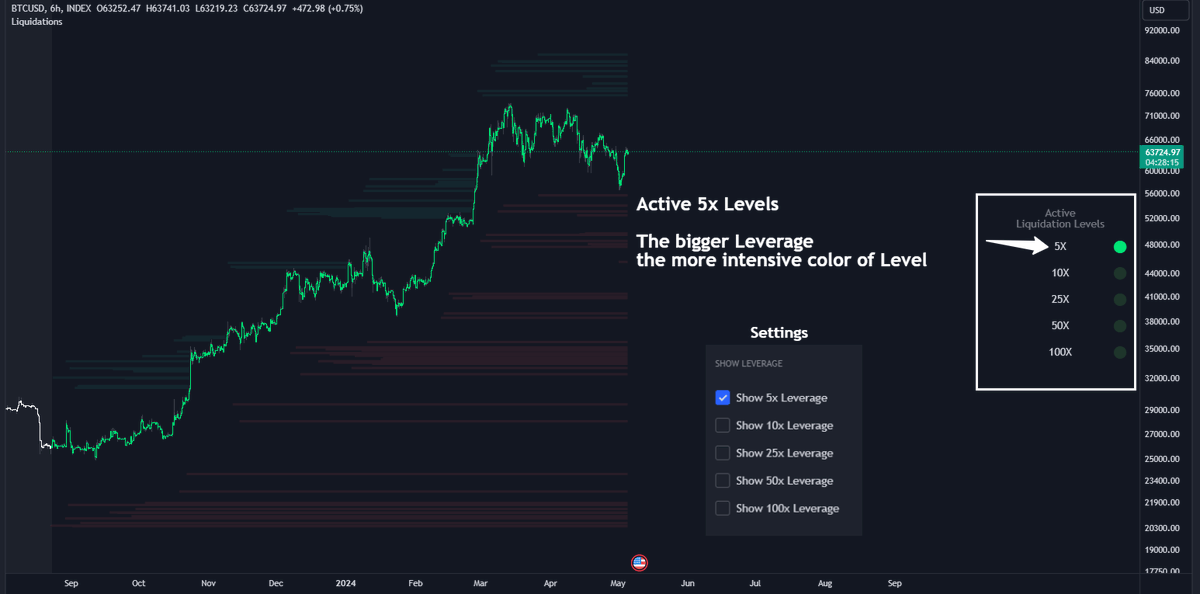
3.1 Liquidation Levels
These liquidation levels are based on clusters of price points where highly leveraged traders open long or short positions.
High leverage is identified as 100x, 50x, and 25x leverages used for both long and short positions. x.com
These liquidation levels are based on clusters of price points where highly leveraged traders open long or short positions.
High leverage is identified as 100x, 50x, and 25x leverages used for both long and short positions. x.com
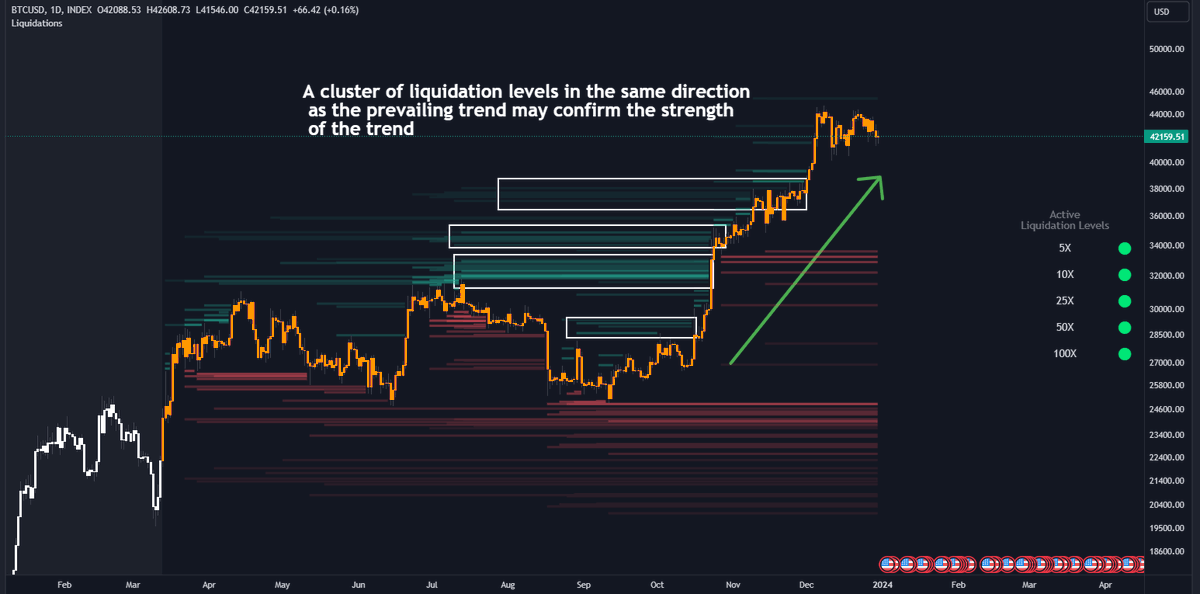
3.2 Liquidation Levels
A cluster of liquidation levels aligning with the trend shows strong market conviction.
Traders are heavily positioned in that direction, reinforcing the trend’s strength. x.com
A cluster of liquidation levels aligning with the trend shows strong market conviction.
Traders are heavily positioned in that direction, reinforcing the trend’s strength. x.com
4. Order Block
Order Blocks are areas where there’s an outstanding amount of limit orders.
A Bullish Order Block indicates that there’s a lot of limit buy orders.
A Bearish Order Block indicates that there’s a lot of limit sell orders. x.com
Order Blocks are areas where there’s an outstanding amount of limit orders.
A Bullish Order Block indicates that there’s a lot of limit buy orders.
A Bearish Order Block indicates that there’s a lot of limit sell orders. x.com
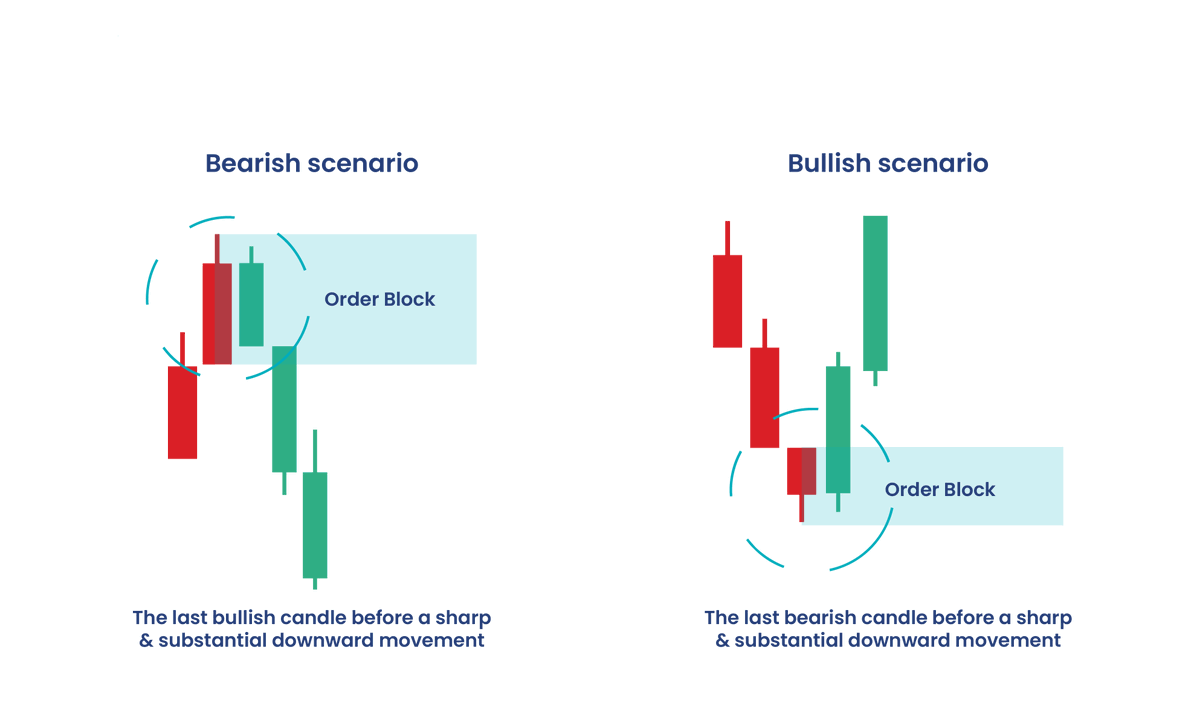
4.1 Order Block
The most common way to identify or find order blocks is by looking for the following pattern.
To identify a valid Order Block:
Look for takeouts and liquidity sweeps, inefficiencies and imbalances. x.com
The most common way to identify or find order blocks is by looking for the following pattern.
To identify a valid Order Block:
Look for takeouts and liquidity sweeps, inefficiencies and imbalances. x.com
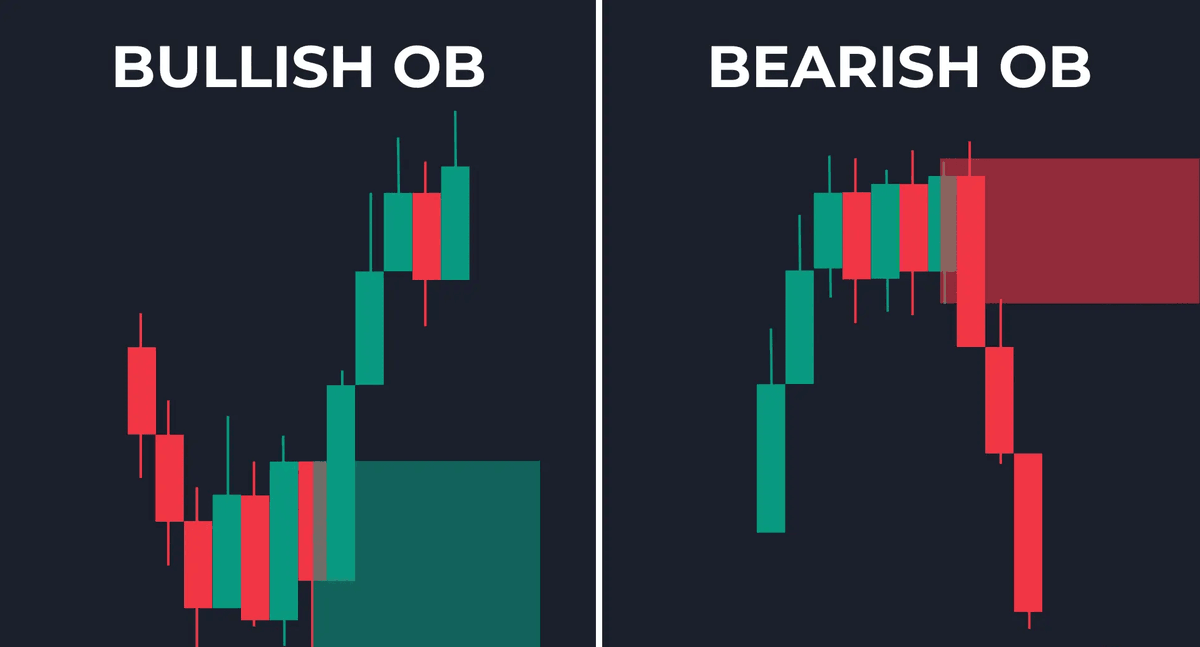
4.2 Order Block
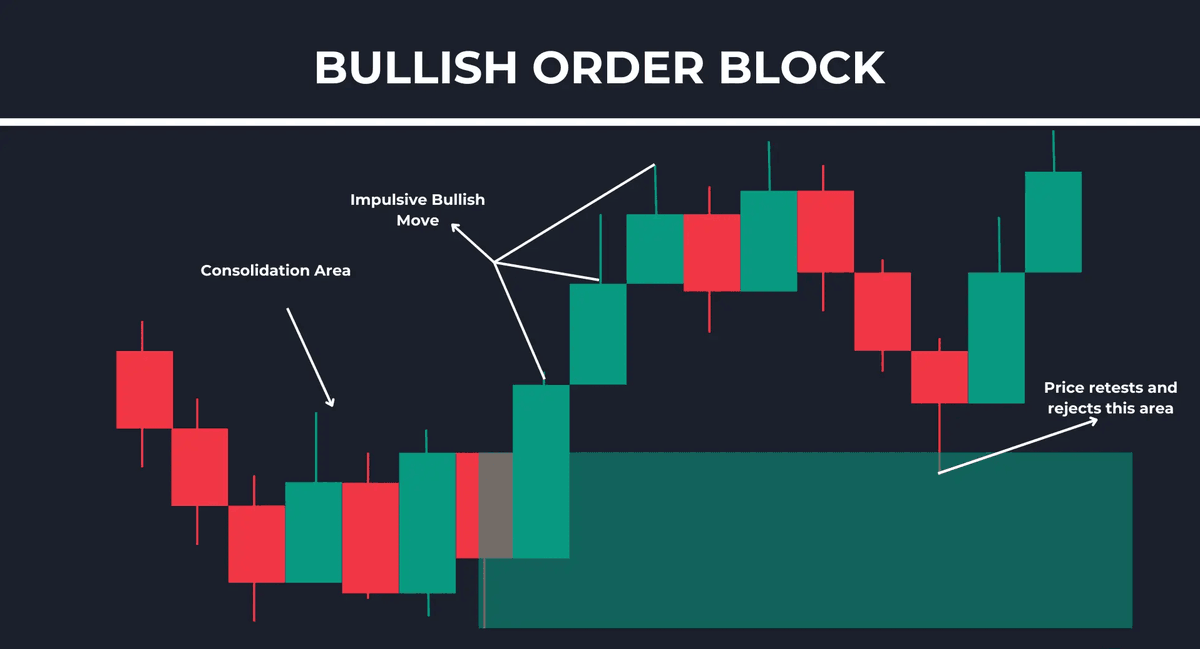
To find a bullish order block, you want to look for an area of consolidation on your chart, followed by a large bullish movement.
Draw your zone from the low of this candle to the high of the candle x.com
To find a bullish order block, you want to look for an area of consolidation on your chart, followed by a large bullish movement.
Draw your zone from the low of this candle to the high of the candle x.com
4.3 Order Block
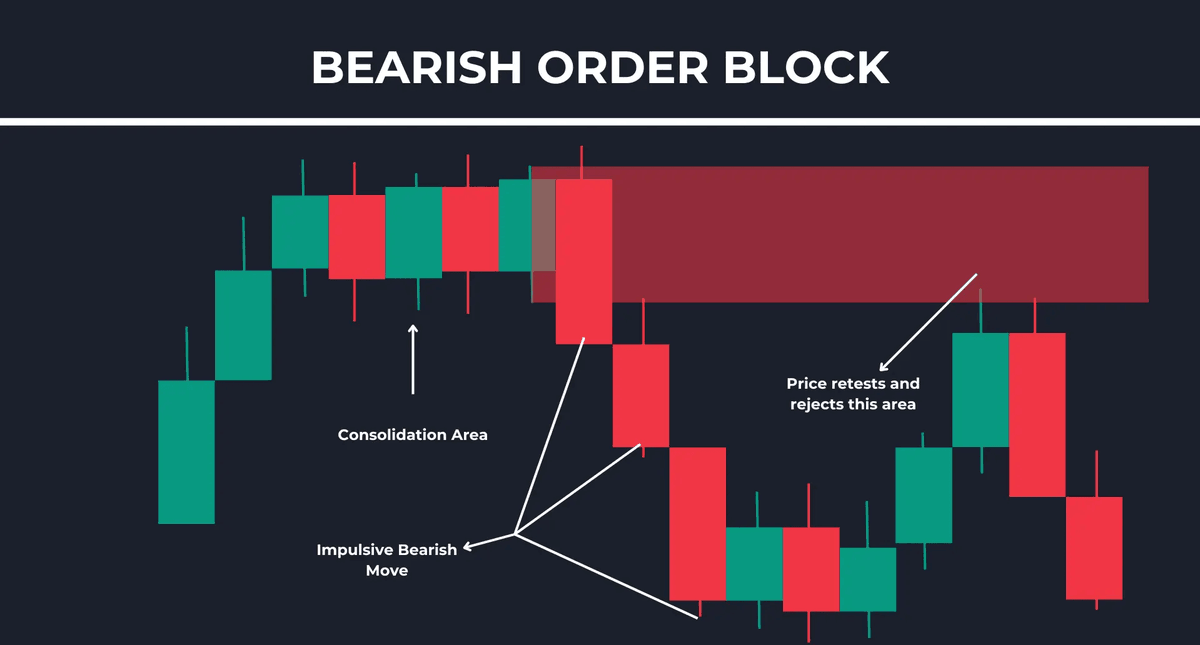
To find a Bearish Order Block, you want to look for an area of consolidation on your chart, followed by a large bearish movement.
Draw your zone from the high of this candle to the low of the candle. x.com
To find a Bearish Order Block, you want to look for an area of consolidation on your chart, followed by a large bearish movement.
Draw your zone from the high of this candle to the low of the candle. x.com
Loading suggestions...