

Relative Strength vs Relative Strength Index
Free Course 🧵
Kindly Retweet and 🩷
Free Course 🧵
Kindly Retweet and 🩷
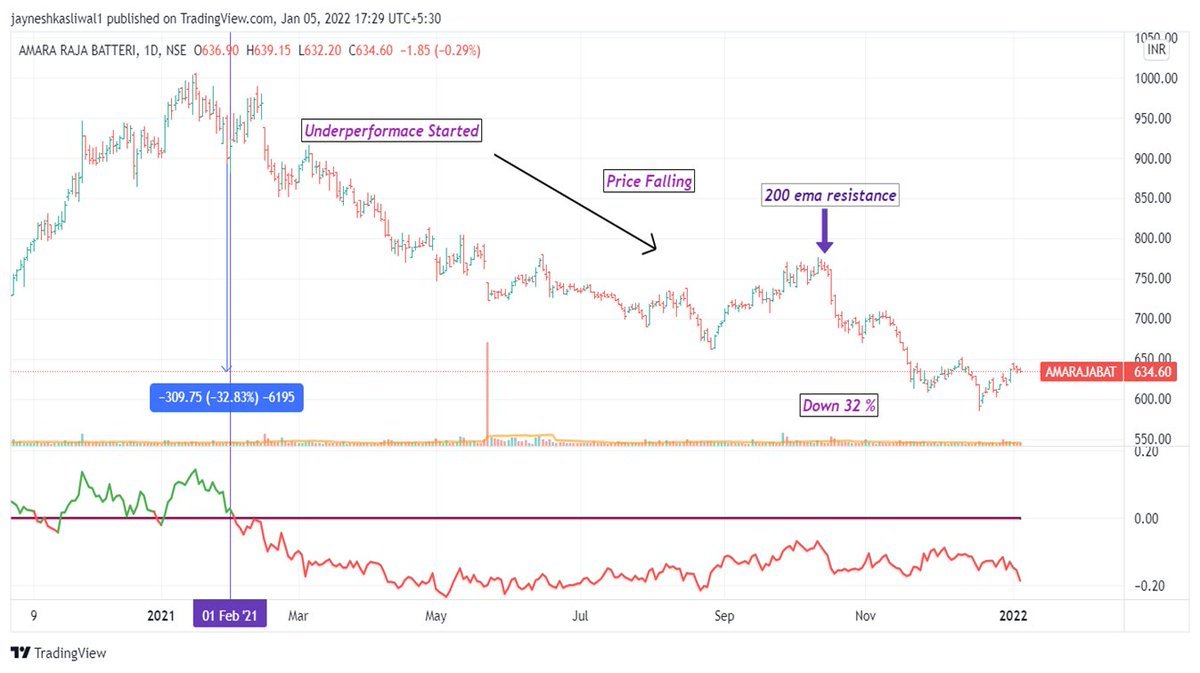
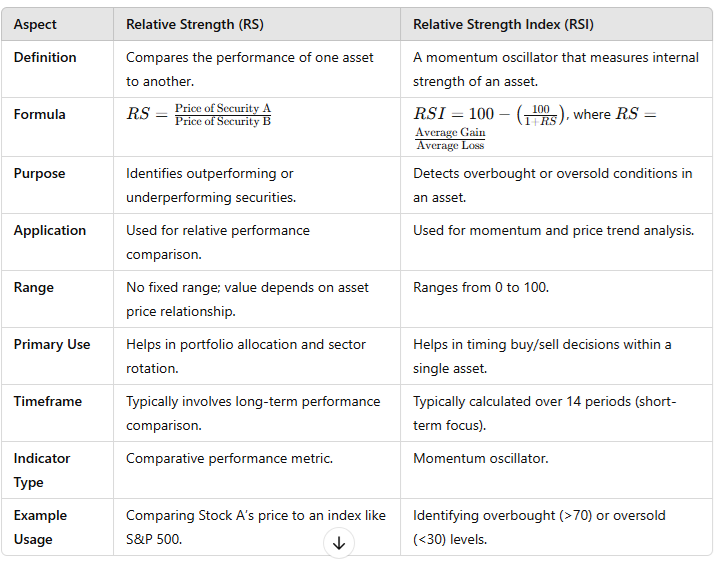
Relative Strength :
¢Relative strength is a strategy used in momentum investing and in identifying value stocks.
¢ It focuses on investing in stocks or other investments that have performed well relative to the market as a whole or to a relevant benchmark.
¢Relative strength is a strategy used in momentum investing and in identifying value stocks.
¢ It focuses on investing in stocks or other investments that have performed well relative to the market as a whole or to a relevant benchmark.
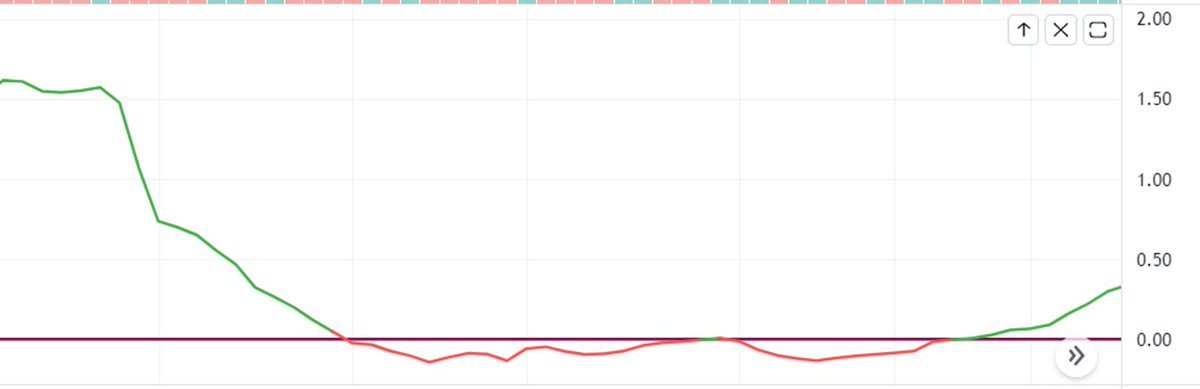
Indicator Values :
💠0 line that helps to differentiate between underperformer and outperformer
💠>1 Outperforming the markets
💠<0 Underperforming the markets x.com
💠0 line that helps to differentiate between underperformer and outperformer
💠>1 Outperforming the markets
💠<0 Underperforming the markets x.com
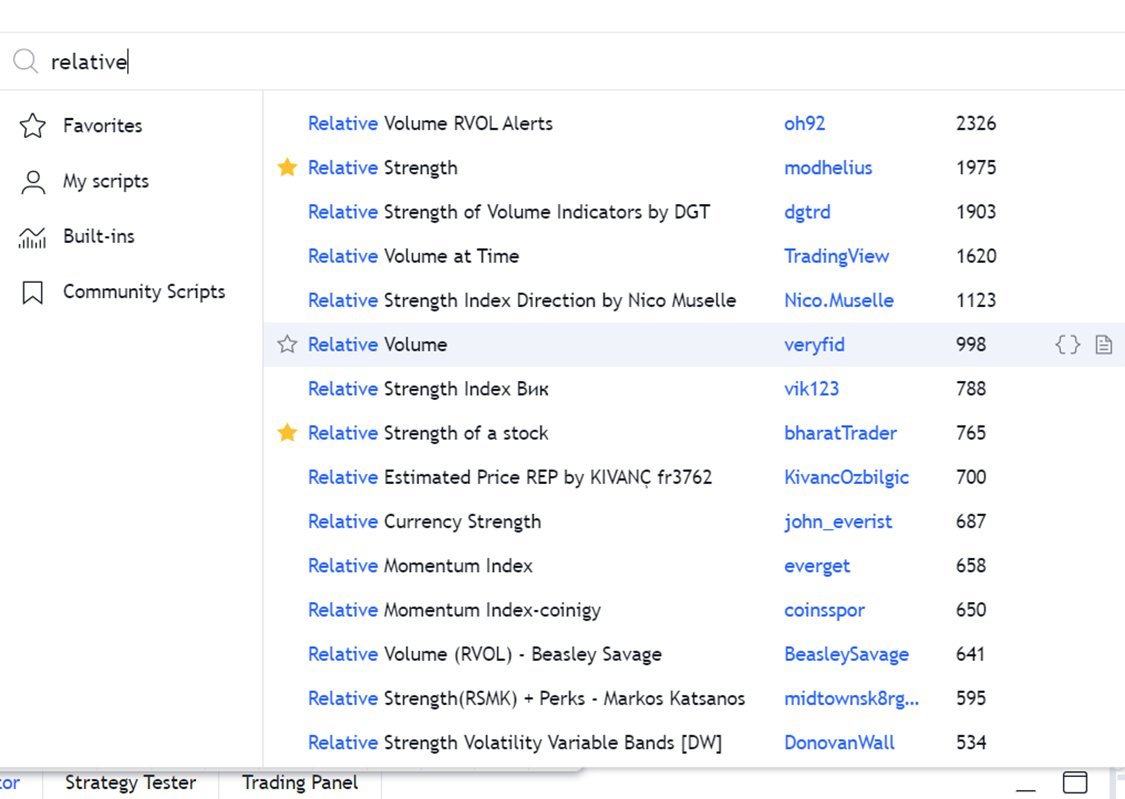
How to Apply :
Step 1: Go to Indicators and Type " Relative Strength"
Choose any
By bharattrader
By traderlion
By Modhelius
I use by bharattrader
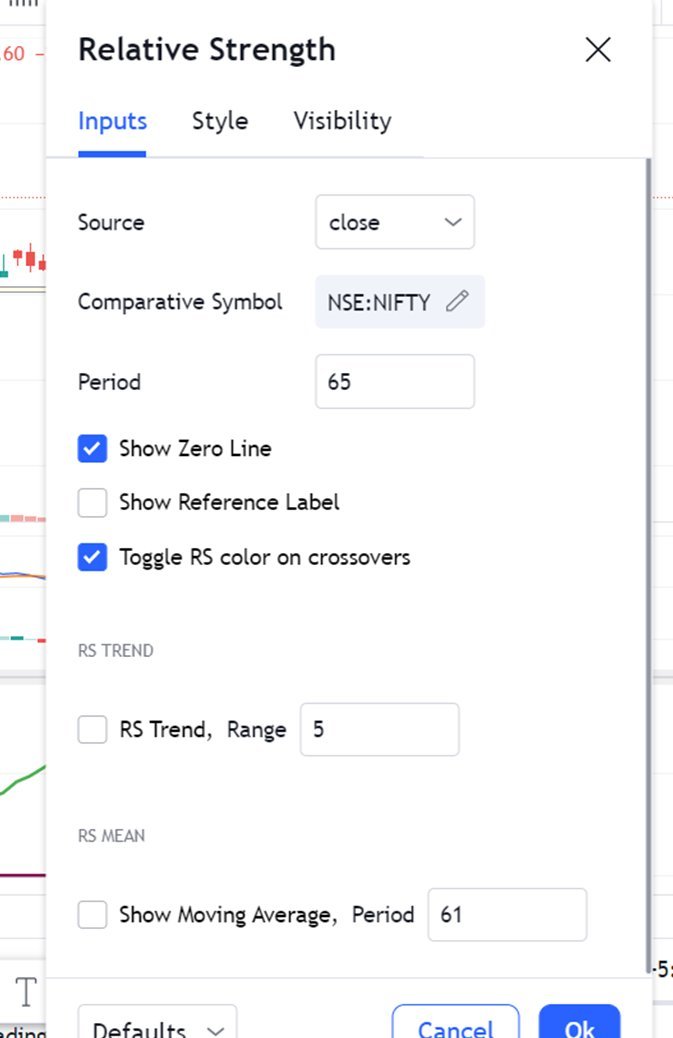
Setting :
Period : 65 for daily , 52 for Weekly x.com
Step 1: Go to Indicators and Type " Relative Strength"
Choose any
By bharattrader
By traderlion
By Modhelius
I use by bharattrader
Setting :
Period : 65 for daily , 52 for Weekly x.com

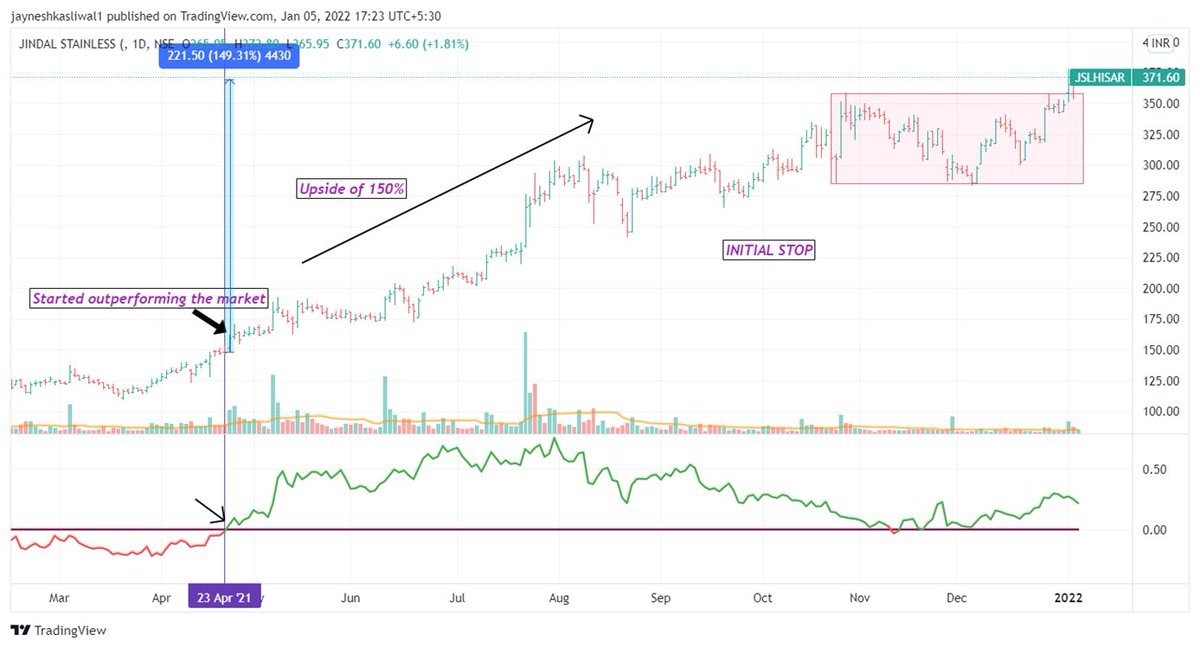
Why RS?
¢Helps to filter out stocks in good momentum and that are giving better returns than nifty
¢These stocks tend to outperform the market for a long term
¢These are potentially superstocks
¢65 period signifies 3 months of trading
¢In 3 months we have around 65 trading days x.com
¢Helps to filter out stocks in good momentum and that are giving better returns than nifty
¢These stocks tend to outperform the market for a long term
¢These are potentially superstocks
¢65 period signifies 3 months of trading
¢In 3 months we have around 65 trading days x.com
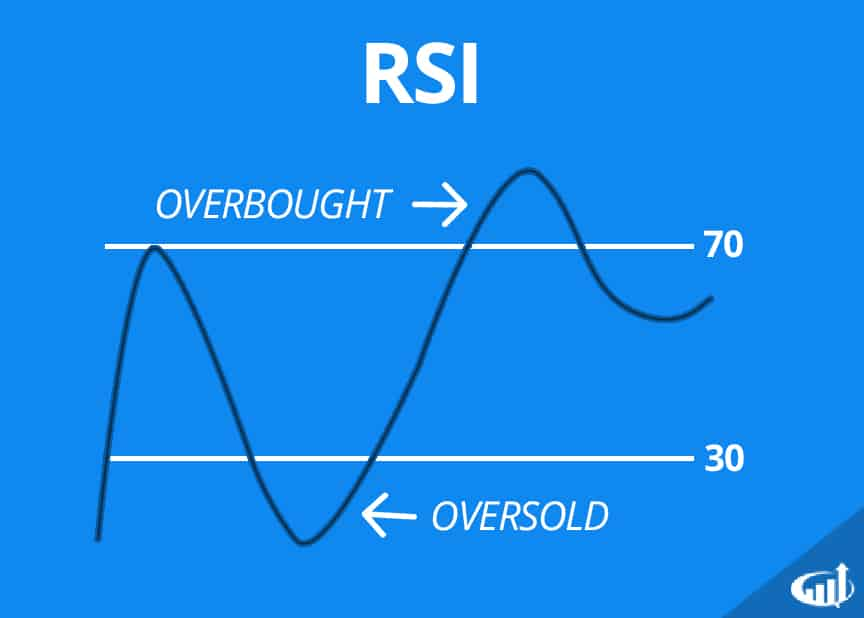
Relative Strength Index :
The Relative Strength Index (RSI) is a popular technical indicator in trading used to measure the speed and magnitude of price movements.
Basically comparing the momentum of the stock with its own self over a defined period
The Relative Strength Index (RSI) is a popular technical indicator in trading used to measure the speed and magnitude of price movements.
Basically comparing the momentum of the stock with its own self over a defined period
Key RSI Levels
70 and Above: Overbought (possible reversal or correction).
30 and Below: Oversold (potential bounce or reversal).
50: Midpoint; can indicate a neutral or consolidating market. x.com
70 and Above: Overbought (possible reversal or correction).
30 and Below: Oversold (potential bounce or reversal).
50: Midpoint; can indicate a neutral or consolidating market. x.com
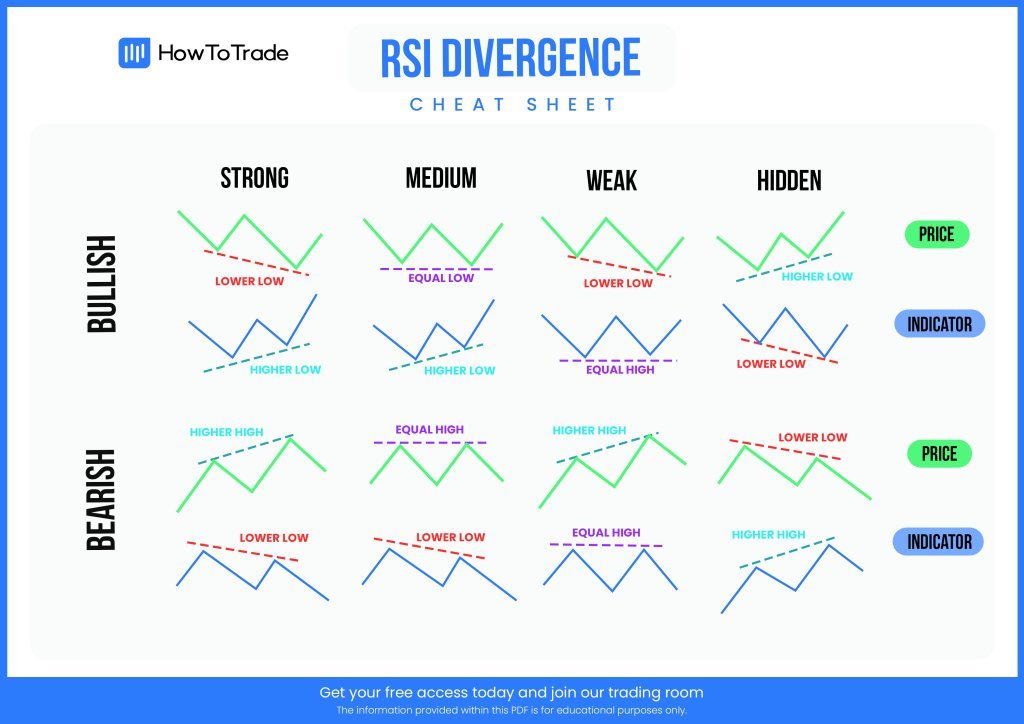
Divergences:
Bullish Divergence: Price makes a lower low, but RSI makes a higher low. This suggests a potential reversal upward.
Bearish Divergence: Price makes a higher high, but RSI makes a lower high. This suggests a potential reversal downward. x.com
Bullish Divergence: Price makes a lower low, but RSI makes a higher low. This suggests a potential reversal upward.
Bearish Divergence: Price makes a higher high, but RSI makes a lower high. This suggests a potential reversal downward. x.com
Trend Confirmation:
In a strong uptrend, RSI may stay in the 40-80 range (with pullbacks near 40).
In a strong downtrend, RSI may stay in the 20-60 range (with pullbacks near 60).
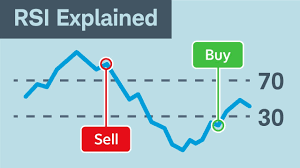
Overbought and Oversold Levels:
When RSI crosses above 70, the asset might be overbought, signaling a potential sell opportunity.
When RSI drops below 30, the asset might be oversold, signaling a potential buy opportunity.
In a strong uptrend, RSI may stay in the 40-80 range (with pullbacks near 40).
In a strong downtrend, RSI may stay in the 20-60 range (with pullbacks near 60).
Overbought and Oversold Levels:
When RSI crosses above 70, the asset might be overbought, signaling a potential sell opportunity.
When RSI drops below 30, the asset might be oversold, signaling a potential buy opportunity.

Loading suggestions...