

Find the Leaders Early: A Trader’s Guide to Spotting Big Winners
Stock selection is everything. If you don’t know where to focus, you’ll waste time on the wrong stocks.
I follow a simple scanning process daily & weekly to narrow down the best names. Let me break it down step by step.👇
Stock selection is everything. If you don’t know where to focus, you’ll waste time on the wrong stocks.
I follow a simple scanning process daily & weekly to narrow down the best names. Let me break it down step by step.👇
A Step-by-Step Guide Step
1: Scan the 52-Week High List
Everyday, I look at stocks near their 52-week highs. I track stocks within 20% of their 52-week high. I only focus on stocks that moved 4%+ in a day, these show real strength.
Daily scans give me new names, but weekends are for deeper research. I go through the entire 52-week high list and add strong names to a separate watchlist. This helps me track consistent movers and spot emerging trends early.
Start your scan here - chartink.com
Step 2: Shortlisting the Best Stocks
Now, it’s time to refine the list further.
If I notice multiple stocks from the same sector showing strength, I pay close attention—strong stocks tend to move in groups.
I also check whether a stock is breaking out or forming a solid base—if it is, it stays on my list.
Additionally, I look for unusual volume spikes, as they indicate strong institutional interest.
By following this process, I filter out the noise and focus only on the best setups.
For example: In one of my scans, I noticed multiple textile stocks appearing in past. That was my first clue that something big was happening in the sector.

Step 3: Identifying High-Potential Sectors
Not all strong sectors give big moves. To filter them further, I ask myself:
-Does this sector have a strong catalyst?
-Is there a big trend forming that can last for months or years?
For example:
-If a sector is facing headwinds, the move might be short-term.
-If a sector has strong policies supporting it, the trend might be long-term.
This step helps me separate short-term movers from true market leaders.
Step 4: Techno-Funda Analysis
Now, I take the strongest stocks from the strongest sectors and analyze them further.
Price Action Check: Are they forming big bases or clean flag patterns? Or is the move already extended?
Valuation vs Growth: Are the current valuations reasonable compared to their growth potential?
This ensures I don’t just chase momentum—I focus on high-quality setups.
Now, let’s look at a few examples of how these stocks moved after hitting their 52-week highs!
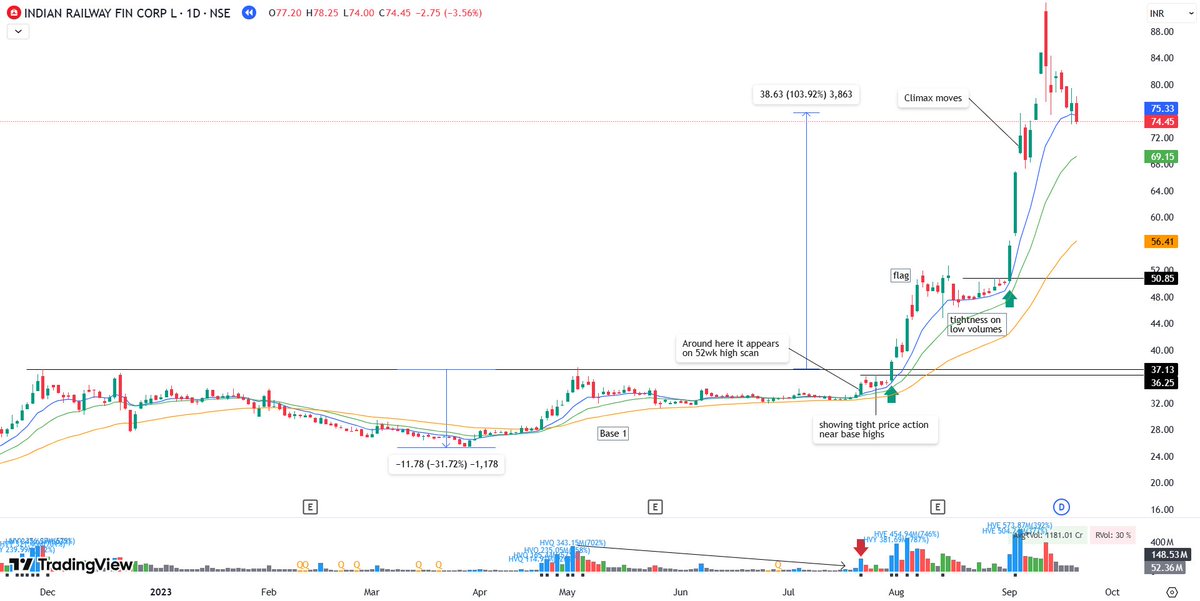
1. IRFC - 103% in 36 days
Catalyst:
-Record ₹2.4 lakh crore allocation for Indian Railways in the Union Budget 2023-24
-Entire railway sector was in focus, as it was in the early stages of a sectoral uptrend.
It comes to 52 week high range along with other railway names indicating a strength in the sector plus the price action quality.
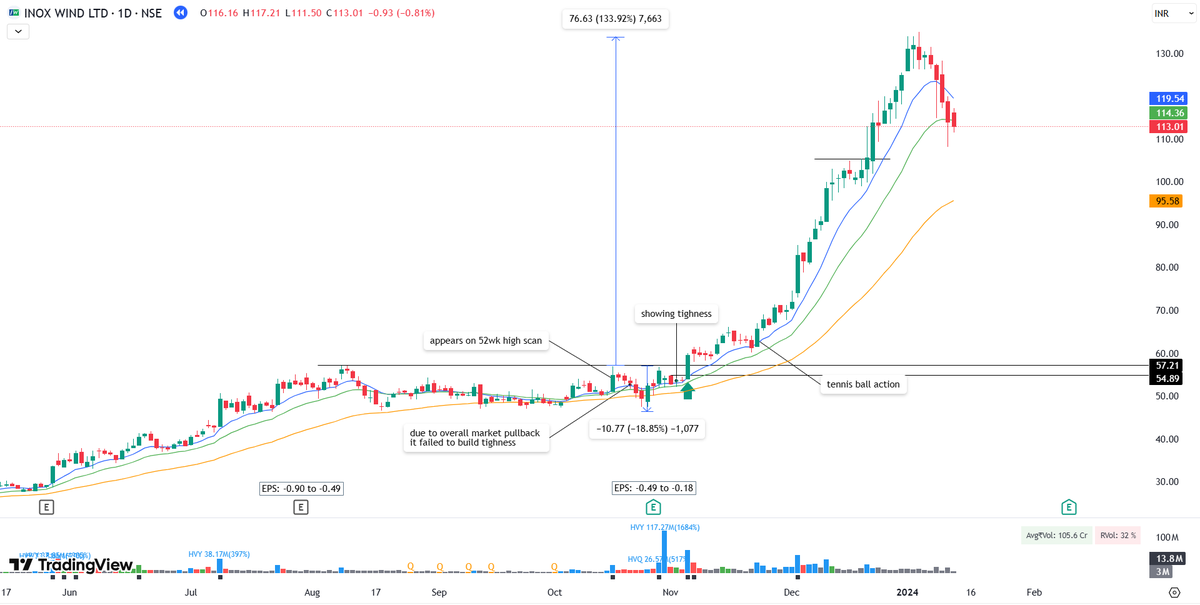
2.Inoxwind - 133% in 56days
Catalyst:
-Strong orderflows & government support.
-Renewable energy sector was in the early to middle stage of its move.
Same thing comes and stays in 52 week high list along with names from the same sector. x.com
Catalyst:
-Strong orderflows & government support.
-Renewable energy sector was in the early to middle stage of its move.
Same thing comes and stays in 52 week high list along with names from the same sector. x.com
Found this valuable?
Don’t keep it to yourself!
Follow me @ItsVinay01 for more game-changing insights!
Bookmark & Retweet—because great traders share great knowledge!
Disclaimer: This thread is for educational purposes only and not financial advice. Always do your own research!
Don’t keep it to yourself!
Follow me @ItsVinay01 for more game-changing insights!
Bookmark & Retweet—because great traders share great knowledge!
Disclaimer: This thread is for educational purposes only and not financial advice. Always do your own research!
Loading suggestions...