

P/E ratio Vs PEG ratio.
Which is better to make money from "Stocks"?👇
Which is better to make money from "Stocks"?👇
What is P/E ratio?
In some words P/E ratio = Current stock price / EPS (Earnings per share) of the year.
Here, Current stock price is the price at which trading is going on or the latest close price of a stock and EPS is Earning per share of recent 4 quarters which is also know as TTM EPS (Trailing 12 months ).
Lets take an example and calculate the P/E ratio for a company for better understanding.

Lets take Reliance Industries.
Current Price - 2840/-
For EPS let me show you what data you need.
So TTM EPS = 28.53+ 23.67 + 25.71+ 25.52 = 103.43
So P/E ratio = 2840/103.43 = 27.4
Now PE ratio is available at many places but its important to understand where it comes from for knowing its significance.
Current Price - 2840/-
For EPS let me show you what data you need.
So TTM EPS = 28.53+ 23.67 + 25.71+ 25.52 = 103.43
So P/E ratio = 2840/103.43 = 27.4
Now PE ratio is available at many places but its important to understand where it comes from for knowing its significance.
Significance of P/E ratio:
P/E ratio gives us an idea on the valuation of the stock or company. Their is a saying that a lower P/E ratio means the valuations are attractive whereas a higher P/E ration means valuations are expensive and the stock shall be avoided.
So, that means the P/E ratio shall be taken at its face value ? A stock with 5 P/E is cheap and a stock with 40 PE is expensive ?
No not at all, this is the biggest misunderstanding many have with P/E ratio. The nos. straight to its face value can be a trap.
So, in short significance of P/E ratio is to give an idea on valuations of a stock nut we can not just take it to its face value.
So, how to extract a better meaning from P/E ratio to help it make our trading or investing better.
Breaking down the P/E ratio:
“Mark Minervini” says in his book “Trade like a Stock Market Wizard” that many growth stocks with huge potential for earnings growth in near future may be trading a higher P/E ratio which seems expensive to many.
Lets understand this in depth as not all stocks with higher P/E value will be from growth space.
Lets take an example of a higher PE stock:
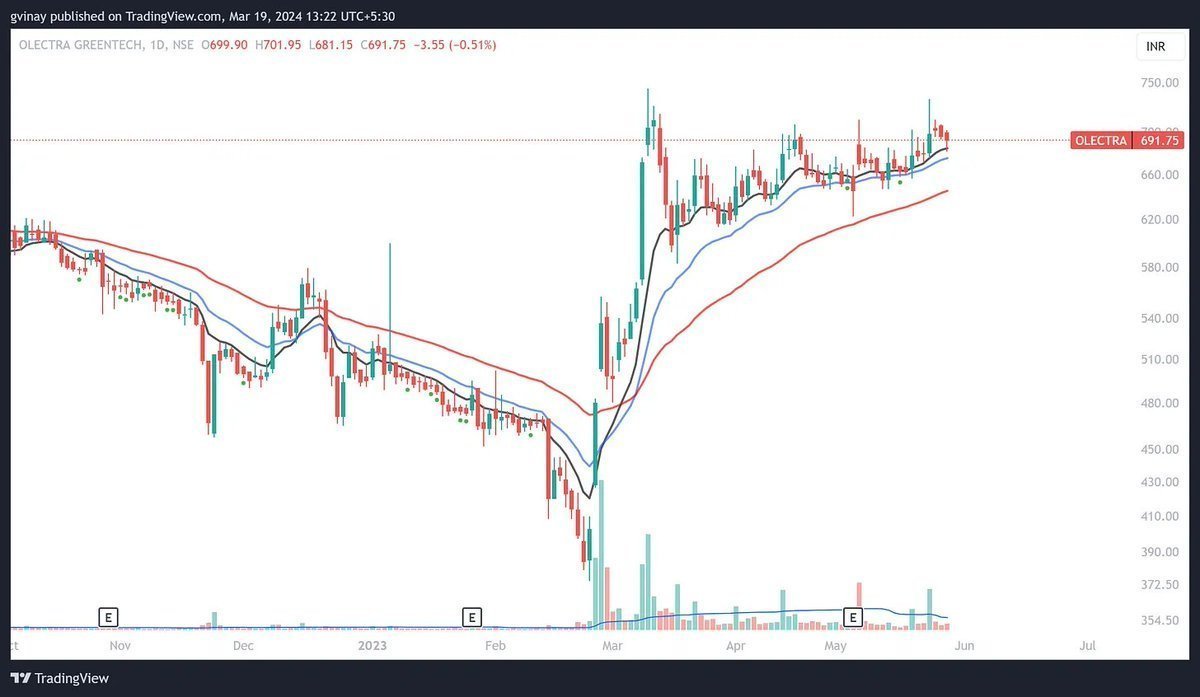
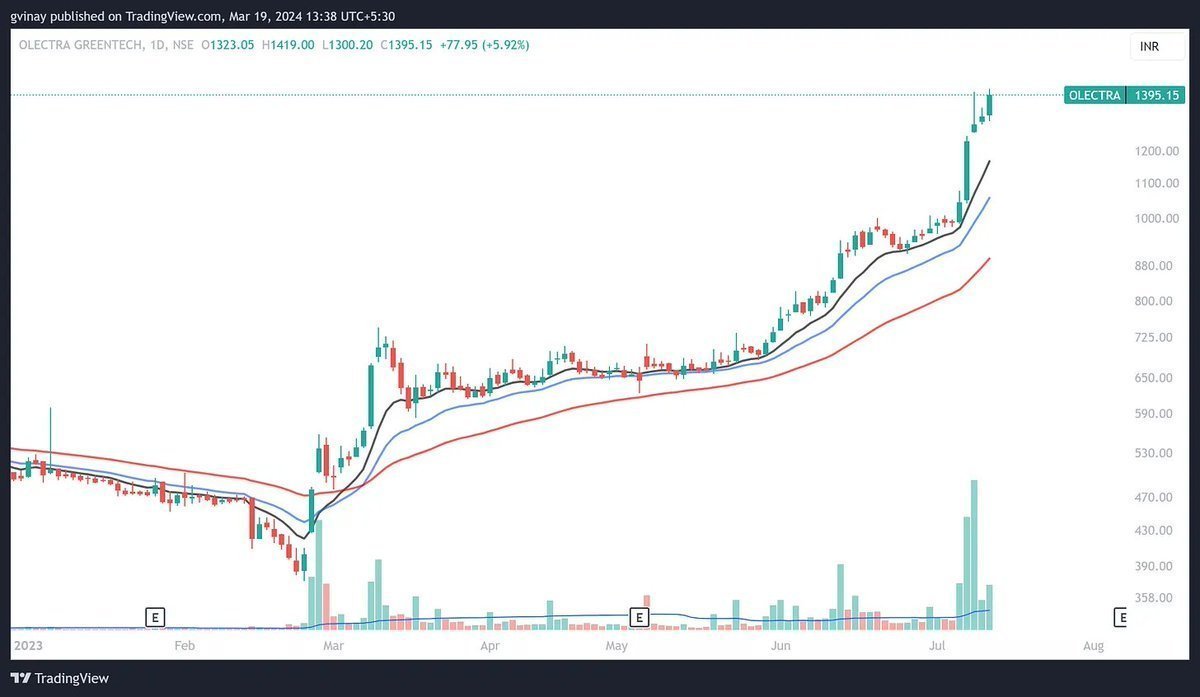
Olectra Greentech May 2023- July 2023:
Now this example was trading at a P/E value of 87 on the day shown below. So, as per the face value it seems very expensive isn’t it and shall be avoided.
This is what many does by taking P/E at face value instead of looking what growth opportunity the company is having in future as “Mark Minervini” says.
Now if we would not gone by the face value but would have checked the growth perspective then following factors could have been surfaced:
Its a Sunrise sector as it belong to Electric vehicle which is expecting a good growth going forward because of the shift to EV’s from conventional vehicles.
Company has a very Good order book which shows good earnings visibility.
Expansion is under way which is going to increase the execution capacity to have a clear growth perspective.
If you all are wondering what is a Sunrise sector and how to extract all the above information, don’t worry we will touch all the factors as we go on.
Let me explain the same thing in a different method.
P/E ratio as we learned is Price/Earnings , So we have earnings in the denominator. If earnings increase with time in next few quarters then the denominator will become heavy right ?
The P/E ratio will ultimately come down because of its future growth assuming price remains same. This shows that in future its P/E value is coming down and depending on growth potential it may come to a no. where its valuation looks really good. (If the Growth opportunity is in such a way)
Now mostly stocks appreciate in price in good market environments which we mostly call as Bull markets, so market many a times may discount the future in favorable markets in expectation that the future earnings will take care of the valuations.
Say market take the P/E to 150 because of the price appreciation now when the earnings in next few quarters gets better P/E will start to get normalized.
Now this is also called “Growth Stock Investing”
So, in our example market did the same things giving a price appreciation to the company looking at its future potential.
So till now we understood that a higher P/E ratio doesn’t make the company costly just by its face value. We need to dig deeper to come to a conclusion.
Now lets take an example of a lower P/E stock to understand a low P/E always doesn’t mean an opportunity.
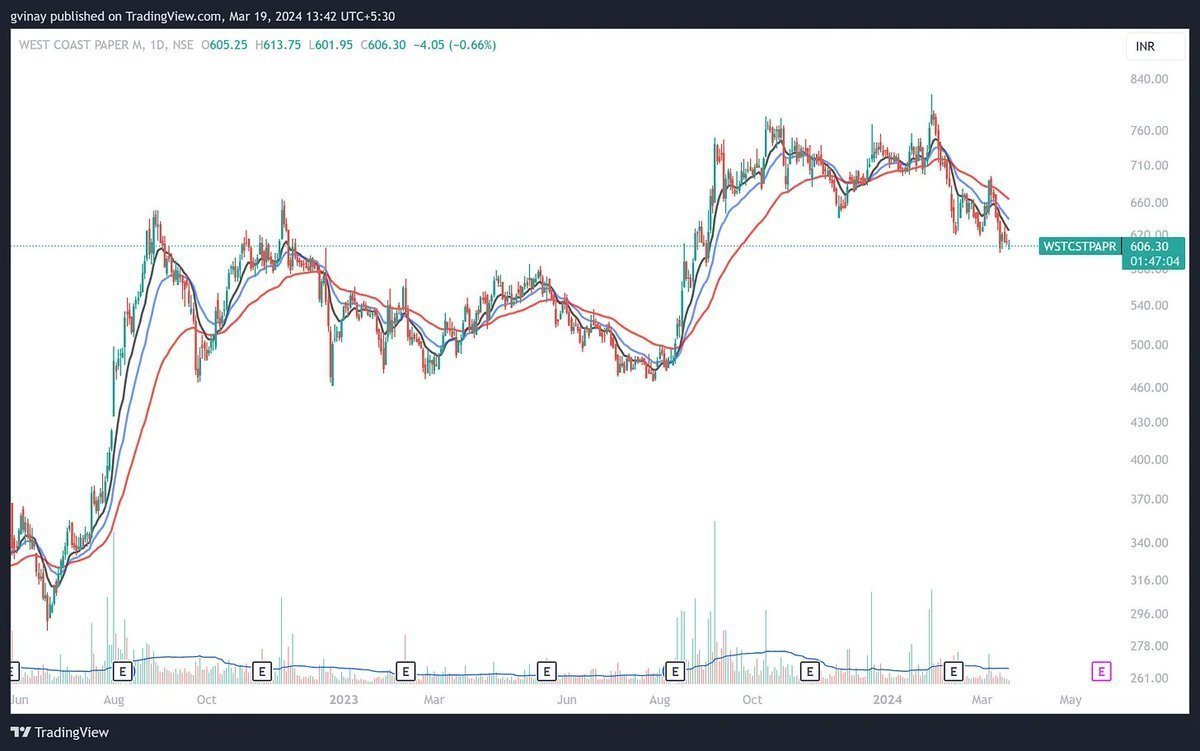
Lets take an example of a Lower PE stock:
Example- West coast paper
Now it traded the whole year within a P/E range of 5-8 which looks really cheap just by its face value but market did not give value to the stock by appreciating its price.
Why?
Just because of the opposite reasons it may have compared to the High P/E example. It belongs to sector which may be loosing its value because of Digitization so , in future growth might not be their.
So, now by face value it looks cheap but when we dig deep it isn’t exactly as market is not favoring the sector.
Now lets take an example of a lower P/E stock to understand a low P/E always doesn’t mean an opportunity.
Lets take an example of a Lower PE stock:
Example- West coast paper
Now it traded the whole year within a P/E range of 5-8 which looks really cheap just by its face value but market did not give value to the stock by appreciating its price.
Why?
Just because of the opposite reasons it may have compared to the High P/E example. It belongs to sector which may be loosing its value because of Digitization so , in future growth might not be their.
So, now by face value it looks cheap but when we dig deep it isn’t exactly as market is not favoring the sector.
Now we know how to calculate P/E ration and what is the significance. Also we understood that a higher P/E doesn’t always mean a expensive stock and lower P/E doesn’t always indicates a cheap stock.
Future of the Sector or company can be thought of to make a decision on whether it has growth potential or not.
Lets now understand more advanced side, Forward P/E.
Future of the Sector or company can be thought of to make a decision on whether it has growth potential or not.
Lets now understand more advanced side, Forward P/E.
Forward PE tells us whether there is any valuation gap or not in the particular counter.
Because if we are going to invest or trade something then we will only go if there is a chance for us to make money.
So, to understand whether to consider the stock or not we need to learn about Forward PE.
Because if we are going to invest or trade something then we will only go if there is a chance for us to make money.
So, to understand whether to consider the stock or not we need to learn about Forward PE.
Forward PE is extrapolated no. based on future earnings estimates.
If we understand how to calculate normal PE then calculating Forward PE will be easy.
P/E ratio = Current stock price / EPS (Earnings per share) of the year.
Here, Current stock price is the price at which trading is going on or the latest close price of a stock and EPS is Earning per share of recent 4 quarters which is also know as TTM EPS (Trailing 12 months ).
Lets move on to understand Forward PE.
Forward P/E = Price / EPS
So we need future earnings of let’s say next 4 quarters instead of recent 4 quarters for calculating forward PE.
Ways to calculate the Future EPS: (Note- It’s will always be an estimate so one has to keep that in mind)
⚡️ Multiplying the latest quarter EPS by 4 as assumption here will be that they will do at least this much in coming quarters.
⚡️Adding last 2 quarters EPS and then multiply by 2 will give you full EPS. This is more conservative approach.
⚡️ Digging into earnings con calls and PPTs to find what the company is expecting in coming years and then using that data calculating the estimates EPS for the year. This will be a more accurate way but needs more efforts. Lets dive deep in the methods more.
Method 1:
Current EPS * 4
This is the simplest method, Lets see with an example.
Now in this example the company started walking on growth trajectory with earnings picked up in recent quarter.
Before calculation, we have to study the company to some extent to see whether they can maintain the earnings going forward or not.
If yes , then lets proceed
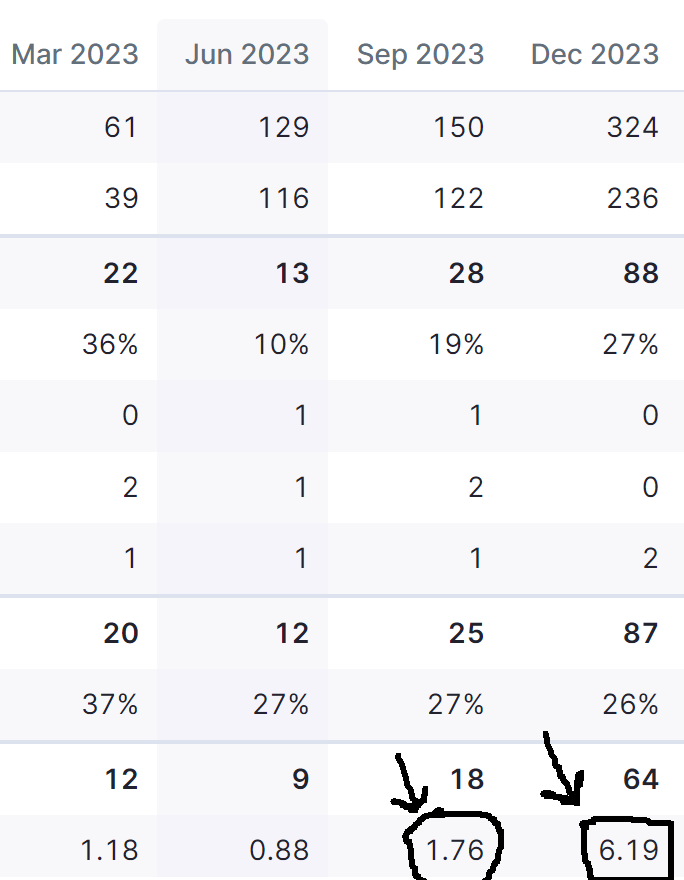
Current Qtr EPS- 6.19
Forward EPS- 6.19* 4 = 24.76
Forward PE- Current price/ Estimated EPS
Forward PE= 570/24.76 = 23.02
This is how we calculate that the company if keeps on performing this is how PE will look one year down the line if the price stays at same place.
Current EPS * 4
This is the simplest method, Lets see with an example.
Now in this example the company started walking on growth trajectory with earnings picked up in recent quarter.
Before calculation, we have to study the company to some extent to see whether they can maintain the earnings going forward or not.
If yes , then lets proceed
Current Qtr EPS- 6.19
Forward EPS- 6.19* 4 = 24.76
Forward PE- Current price/ Estimated EPS
Forward PE= 570/24.76 = 23.02
This is how we calculate that the company if keeps on performing this is how PE will look one year down the line if the price stays at same place.
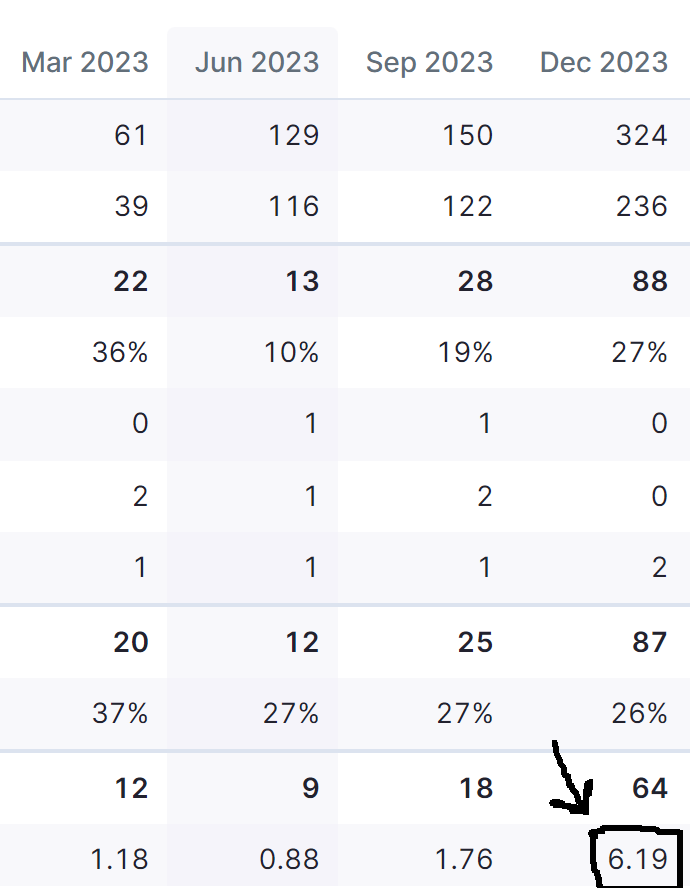
Method 2: Using recent 2 quarters
Last 2 quarter EPS- 1.76 + 6.19
Forward EPS full year = 2* (1.76 + 6.19) = 15.9
Forward PE = 570 / 15.9 = 35.8
This is a bit conservative method as we are taking one quarter where growth was pretty less.
Now Lets compare both methods.
Last 2 quarter EPS- 1.76 + 6.19
Forward EPS full year = 2* (1.76 + 6.19) = 15.9
Forward PE = 570 / 15.9 = 35.8
This is a bit conservative method as we are taking one quarter where growth was pretty less.
Now Lets compare both methods.
First method works best when we understand that the company has started walking on the growth trajectory and this is the first quarter with new growth and they are expecting to grow further or maintain around the same.
Then the second method works best when the company is already walking on the growth path , in that case we can take recent 2 quarters to estimate better.
Understand one thing, we have to also keep updating it as per every successive quarter earnings.
Then the second method works best when the company is already walking on the growth path , in that case we can take recent 2 quarters to estimate better.
Understand one thing, we have to also keep updating it as per every successive quarter earnings.
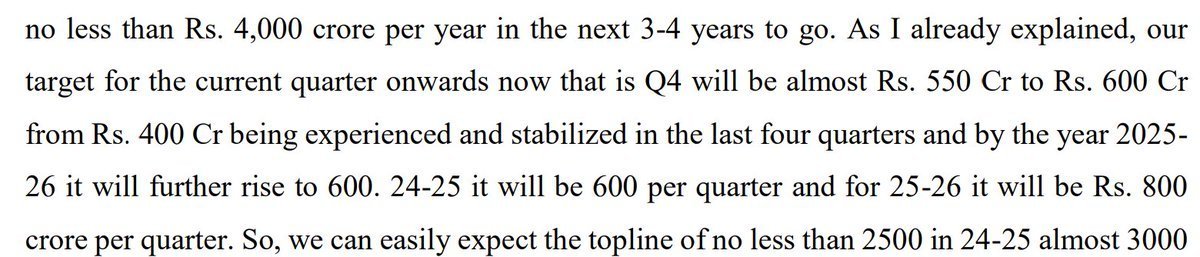
Method 3: Through companies guidance or Order book
In this method we try to understand what company is saying and looking forward to and then we use that to estimate the Forward EPS.
Now the company estimated a Top line/Revenue of around 2500 Cr. So, we have to calculate the EPS based on last years PAT margins to make an estimate.
This EPS will be used to calculate the Forward PE.
Source - Company Con-call Transcript
Conclusion: Forward PE can be a really powerful ratio if we can understand the P/E ratio at which the sector and the company comfortable trades.
This will give you a map on whether there is a valuation gap in the current and future or not.
At last we can use technical analysis to time our entries when the counter shows signs of momentum.
Also its better to verify through con calls or other sources whether the current quarter earnings is on off or a growth trajectory.
Thread has stretched too much So, we will talk about PEG Ratio in next thread.
So, If you want to understand PEG ratio is simple terms and many more such concepts then,
1. Follow me @ItsVinay01 for similar knowledge based threads.
2. Bookmark it and Retweet !
Disclaimer: Everything shared above is for learning purpose only and nothing is in any form any advice.
So, If you want to understand PEG ratio is simple terms and many more such concepts then,
1. Follow me @ItsVinay01 for similar knowledge based threads.
2. Bookmark it and Retweet !
Disclaimer: Everything shared above is for learning purpose only and nothing is in any form any advice.
Loading suggestions...