

1. Volume
A rise in volume is interpreted to signify future sharp rises or drops in price, because it reflects interest and conviction.
Low-volume issues can be susceptible to volatility.
Since lower volume can amplify price movements due to lower liquidity. x.com
A rise in volume is interpreted to signify future sharp rises or drops in price, because it reflects interest and conviction.
Low-volume issues can be susceptible to volatility.
Since lower volume can amplify price movements due to lower liquidity. x.com
1.1 Volume
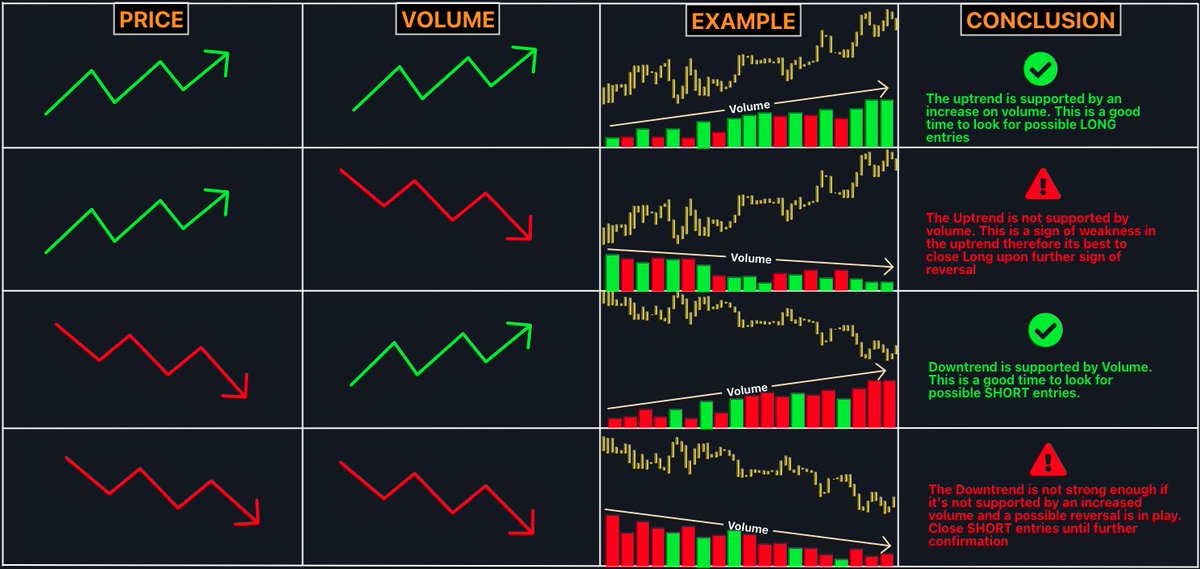
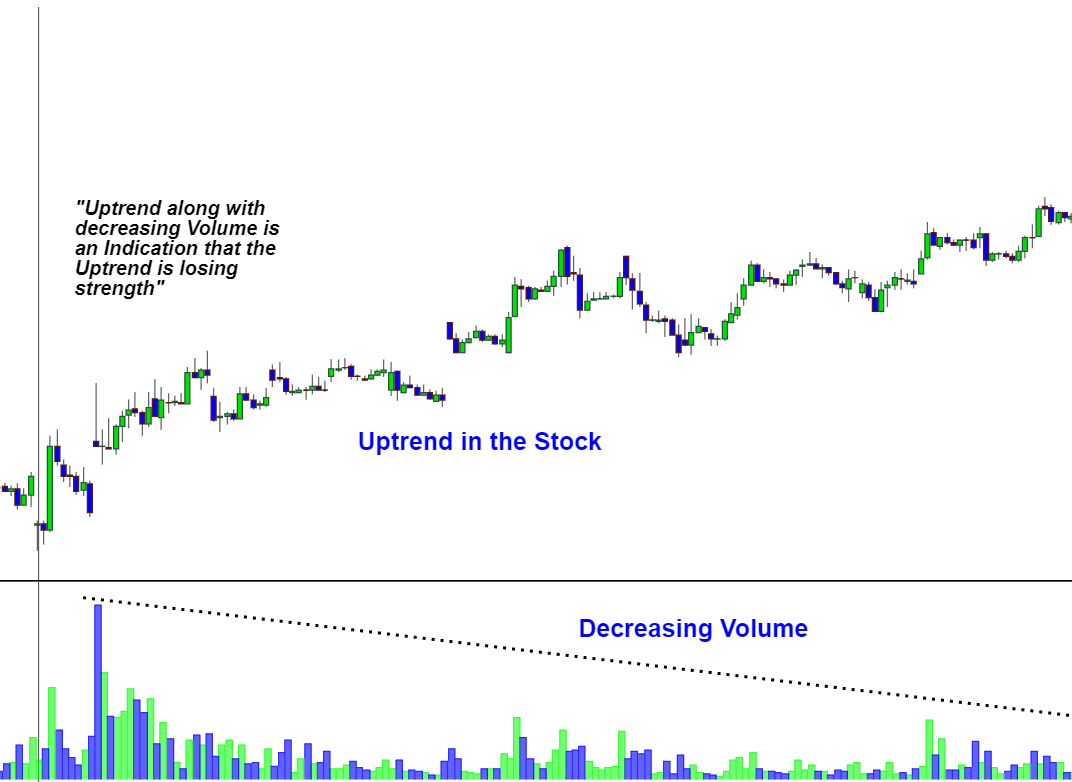
Volume that's declining while prices rise, suggests a weakening trend and an increased likelihood of reversal.
Rising prices with increasing volume typically signal a strong uptrend.
While falling prices with rising volume suggest strong downward pressure. x.com
Volume that's declining while prices rise, suggests a weakening trend and an increased likelihood of reversal.
Rising prices with increasing volume typically signal a strong uptrend.
While falling prices with rising volume suggest strong downward pressure. x.com
1.2 Volume
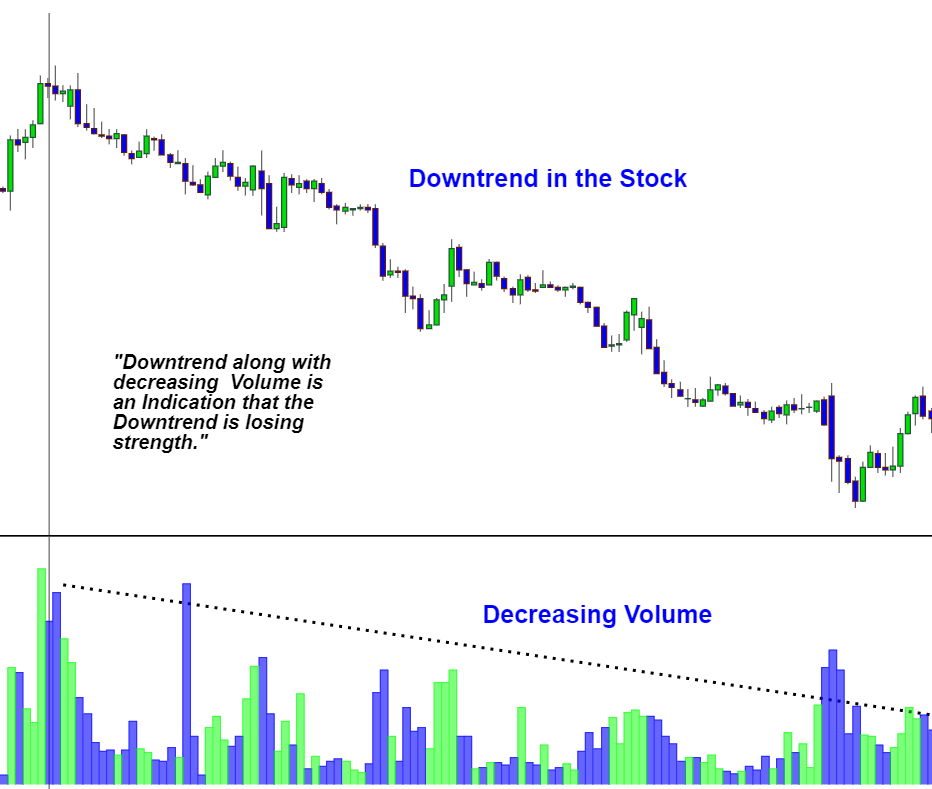
Volume is down and the price is down. Decreasing volume in parallel with falling price indicates a bearish trend.
When volume stops decreasing, and the price keeps going down, it indicates a long-term bearish signal. x.com
Volume is down and the price is down. Decreasing volume in parallel with falling price indicates a bearish trend.
When volume stops decreasing, and the price keeps going down, it indicates a long-term bearish signal. x.com
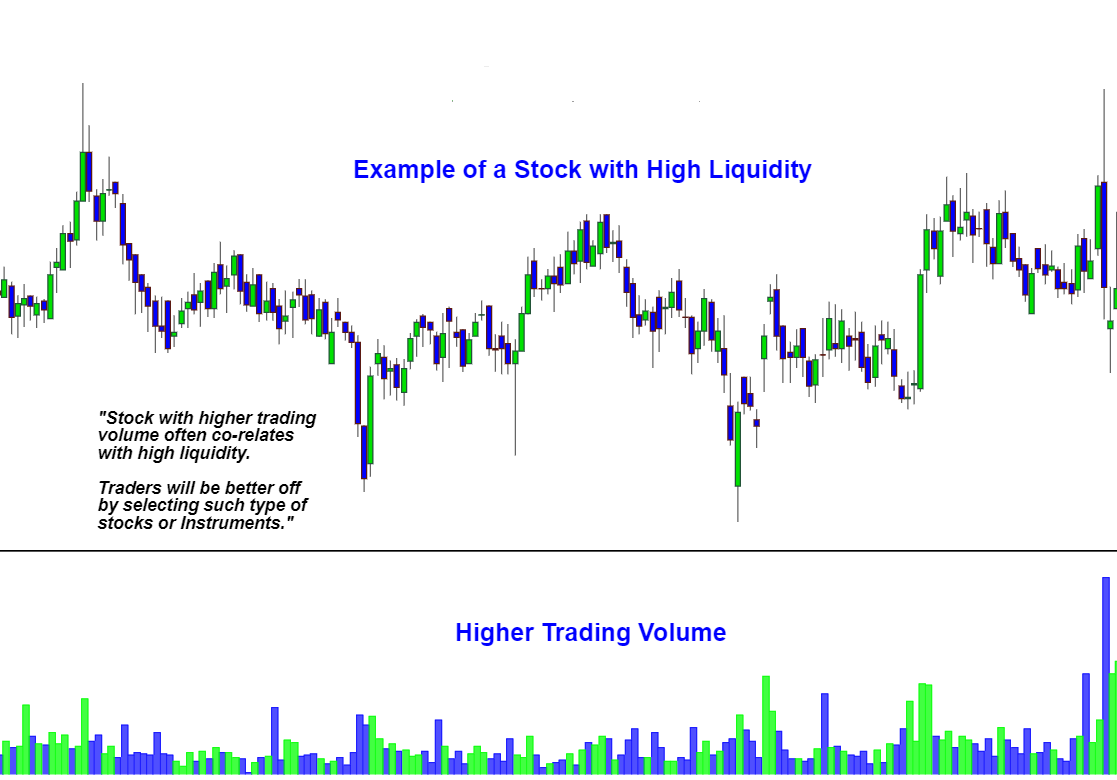
1.3 Volume
Tokens with high liquidity also tend to have higher trading volumes.
Volume and liquidity are both related in terms of market functioning.
The tokens with higher volume are getting traded more easily and quickly than those with lower volume. x.com
Tokens with high liquidity also tend to have higher trading volumes.
Volume and liquidity are both related in terms of market functioning.
The tokens with higher volume are getting traded more easily and quickly than those with lower volume. x.com
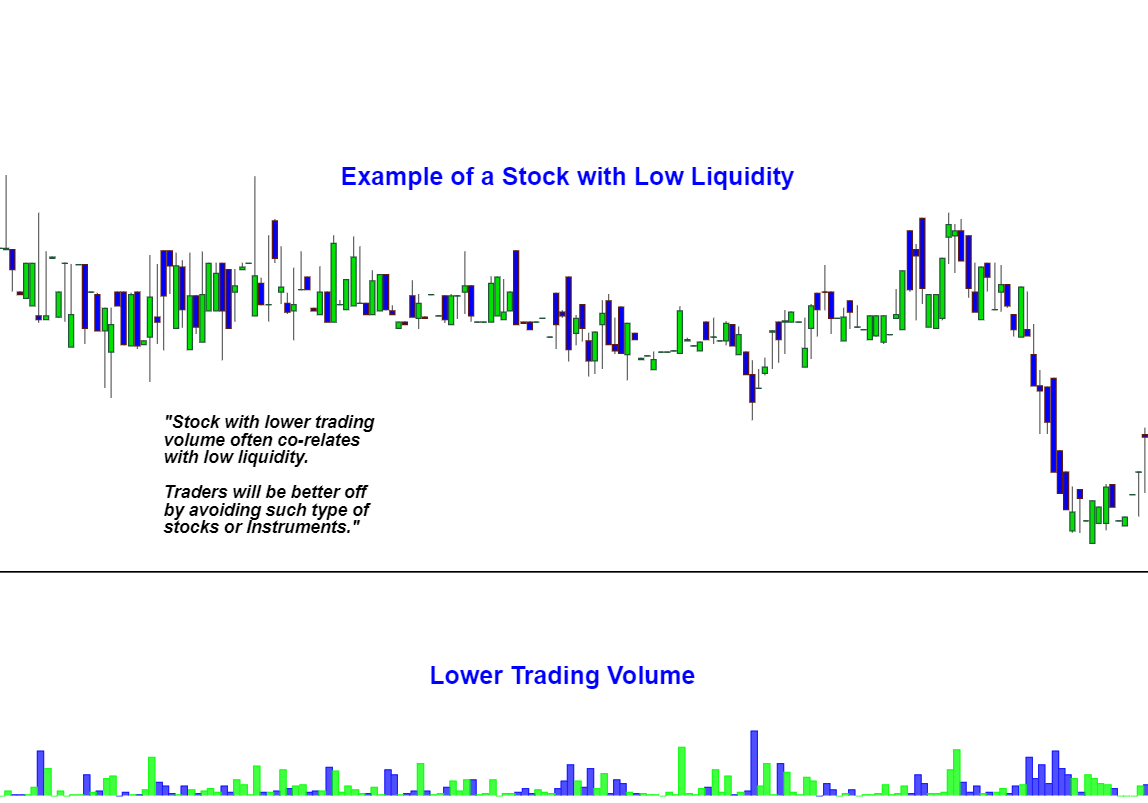
1.4 Volume
When a token has low liquidity, it is prone to sudden price swings.
Caused by large buy or sell orders, which can lead to significant volatility x.com
When a token has low liquidity, it is prone to sudden price swings.
Caused by large buy or sell orders, which can lead to significant volatility x.com
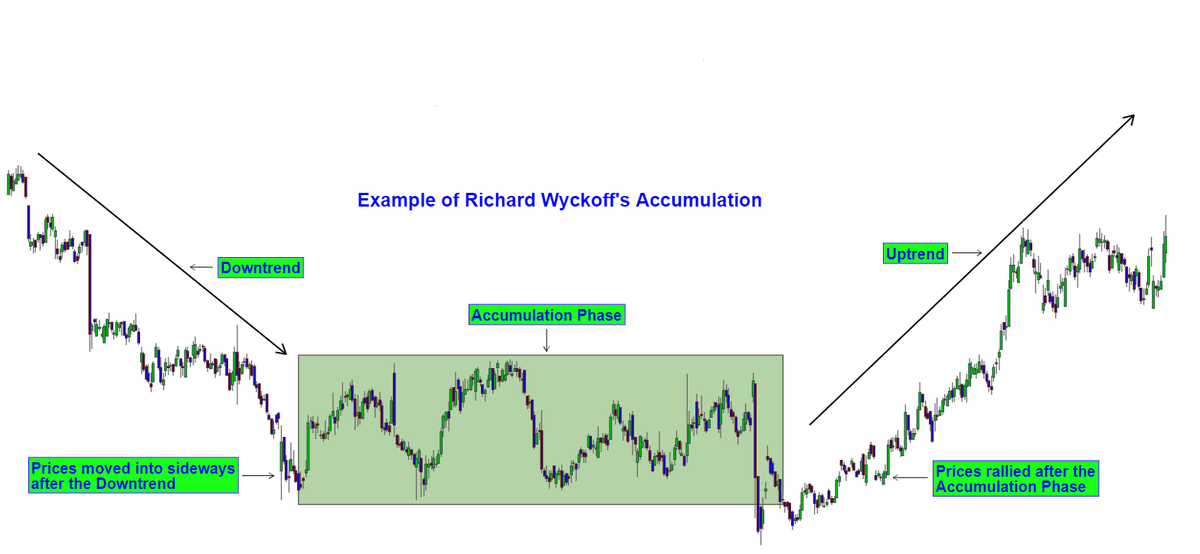
2. Wyckoff
Accumulation is a sideways/range bound market activity that happens after an extended downtrend.
This is the phase where smart money traders and big institutional players try to accumulate.
Without moving the prices too much to the upside. x.com
Accumulation is a sideways/range bound market activity that happens after an extended downtrend.
This is the phase where smart money traders and big institutional players try to accumulate.
Without moving the prices too much to the upside. x.com
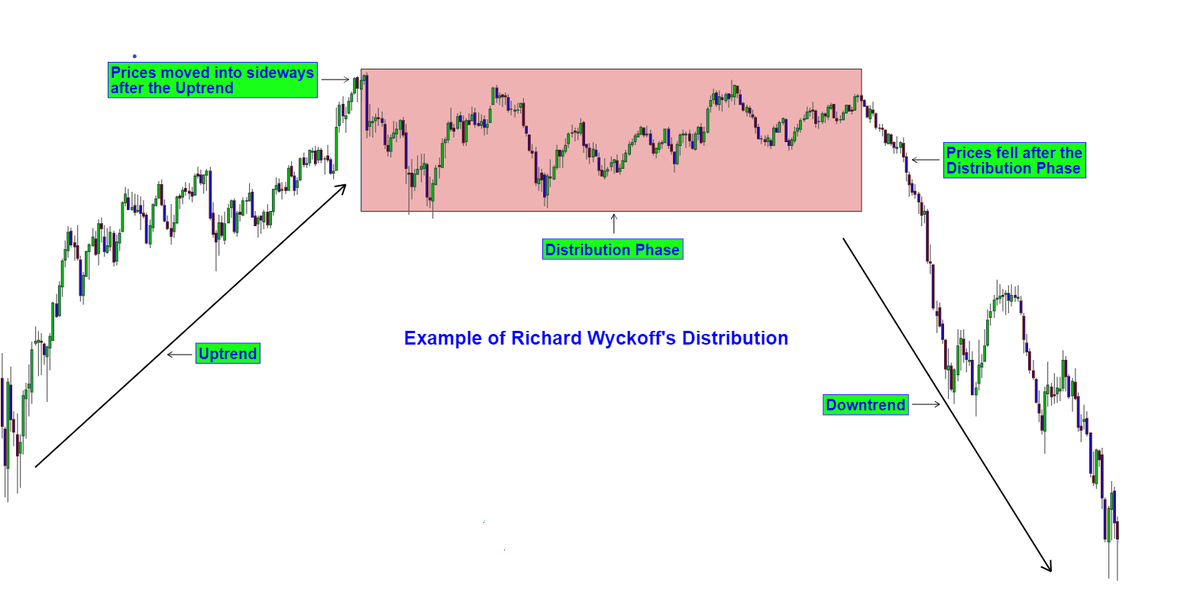
2.1 Wyckoff
Distribution is a sideways/Range bound market activity that happens after an extended Uptrend.
This is the phase where smart money traders and big institutional players try to distribute or sell off their positions. x.com
Distribution is a sideways/Range bound market activity that happens after an extended Uptrend.
This is the phase where smart money traders and big institutional players try to distribute or sell off their positions. x.com
2.2 Wyckoff
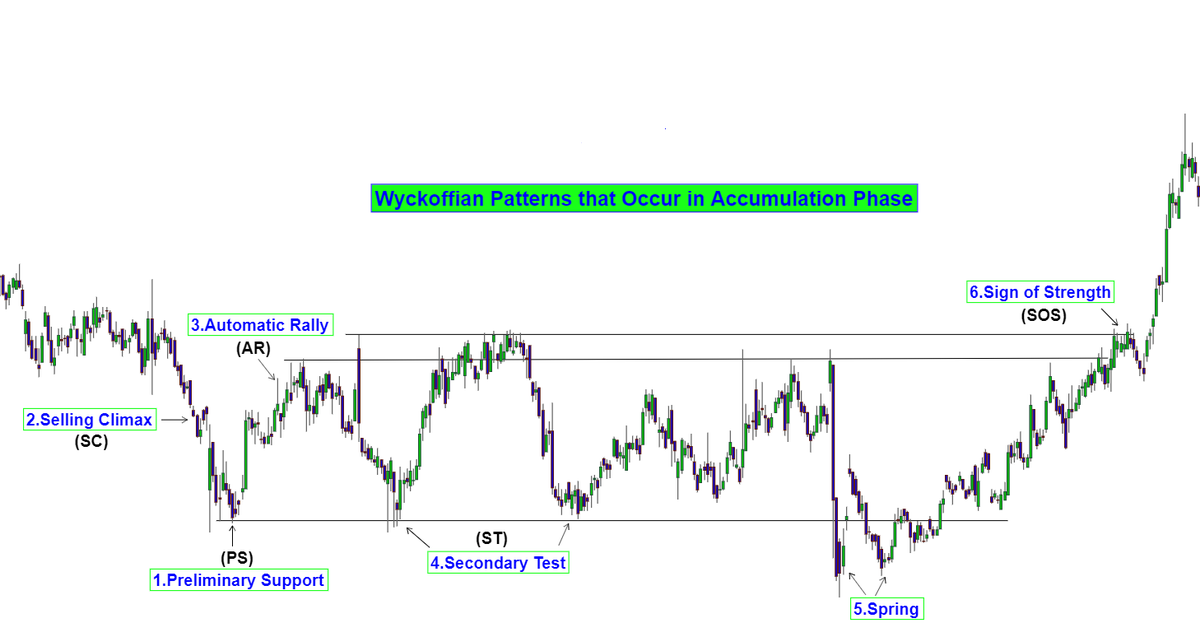
5 Major Wyckoffian Patterns that occurs in Accumulation Phase:
- Preliminary Support (PS)
- Selling Climax (SC)
- Automatic Rally (AR)
- Secondary Test (ST)
- Springs
- Sign of Strength (SOS) x.com
5 Major Wyckoffian Patterns that occurs in Accumulation Phase:
- Preliminary Support (PS)
- Selling Climax (SC)
- Automatic Rally (AR)
- Secondary Test (ST)
- Springs
- Sign of Strength (SOS) x.com
2.3 Wyckoff
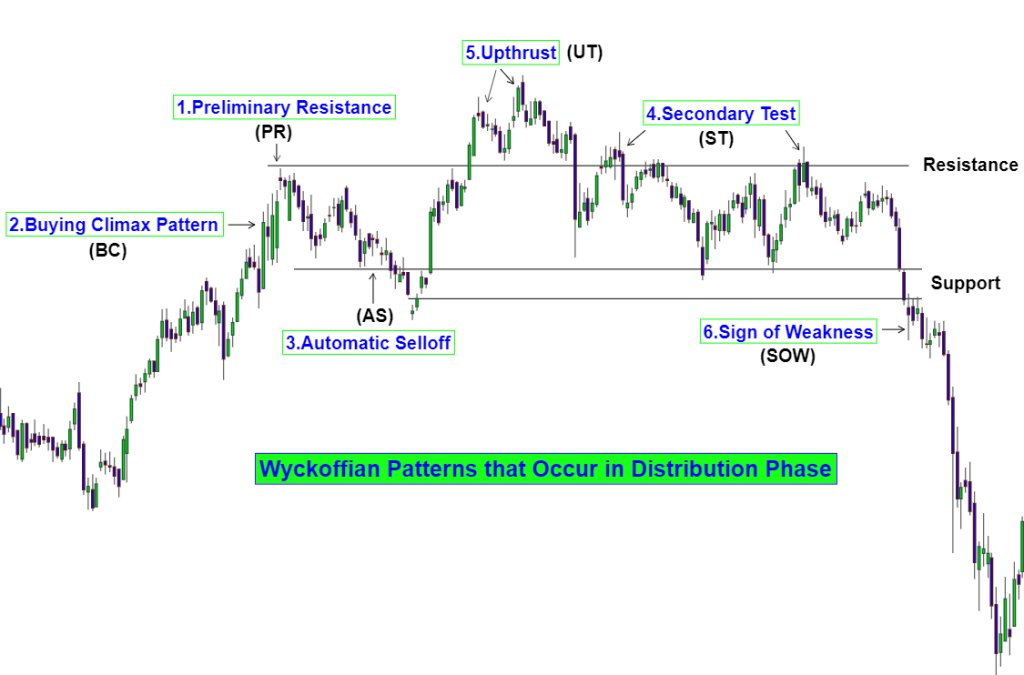
5 Major Wyckoffian Patterns that occurs in Distribution Phase:
- Preliminary Resistance (PR)
- Buying Climax (BC)
- Automatic Selloff (AS)
- Secondary Test (ST)
- Upthrust (UT)
- Sign of Weakness (SOW) x.com
5 Major Wyckoffian Patterns that occurs in Distribution Phase:
- Preliminary Resistance (PR)
- Buying Climax (BC)
- Automatic Selloff (AS)
- Secondary Test (ST)
- Upthrust (UT)
- Sign of Weakness (SOW) x.com
3. Trading Channels
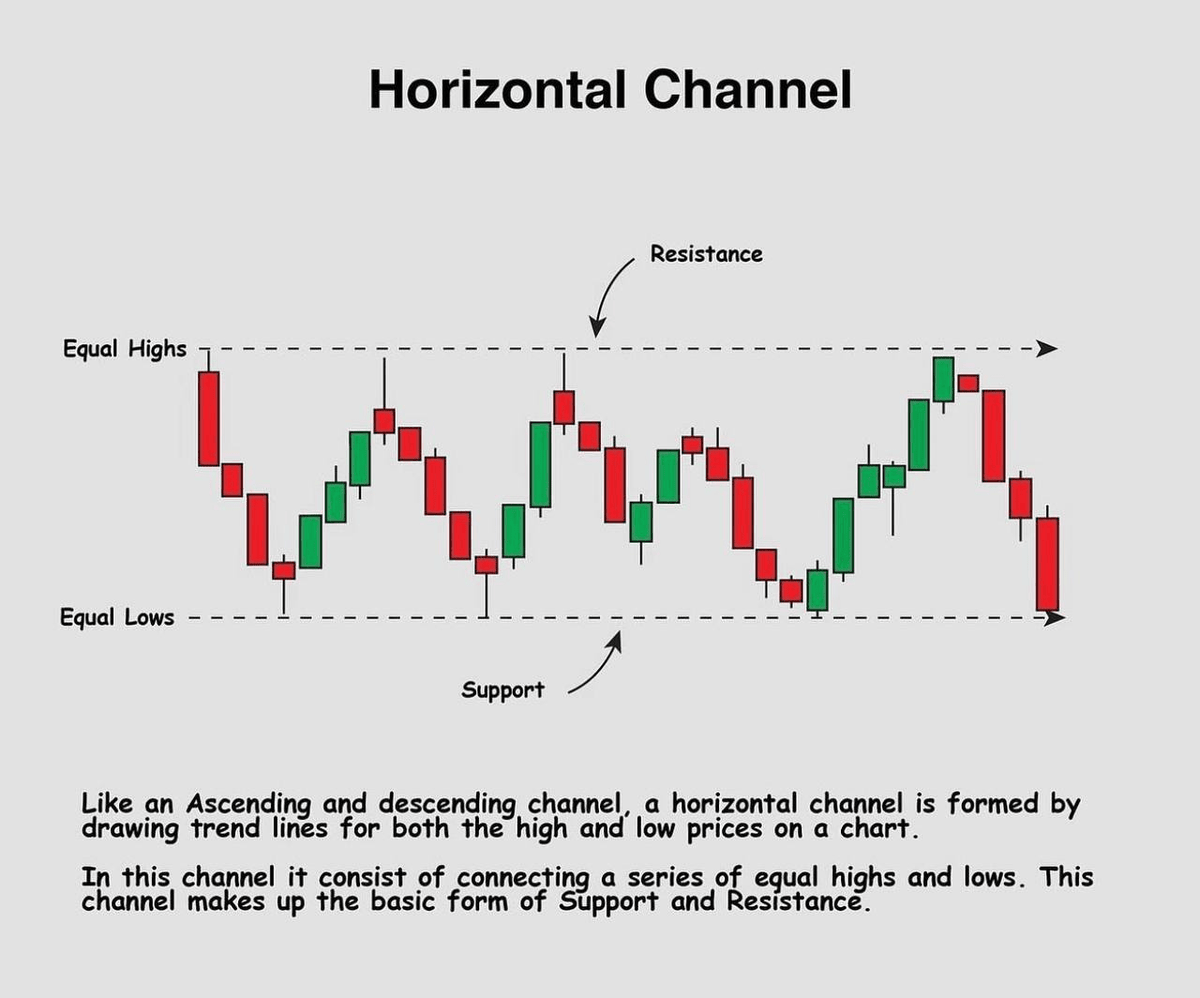
Horizontal channels are trend lines that connect variable pivot highs and lows.
Shows the price contained between the upper line of resistance and the lower line of support.
A horizontal channel is also known as a price range or sideways trend. x.com
Horizontal channels are trend lines that connect variable pivot highs and lows.
Shows the price contained between the upper line of resistance and the lower line of support.
A horizontal channel is also known as a price range or sideways trend. x.com
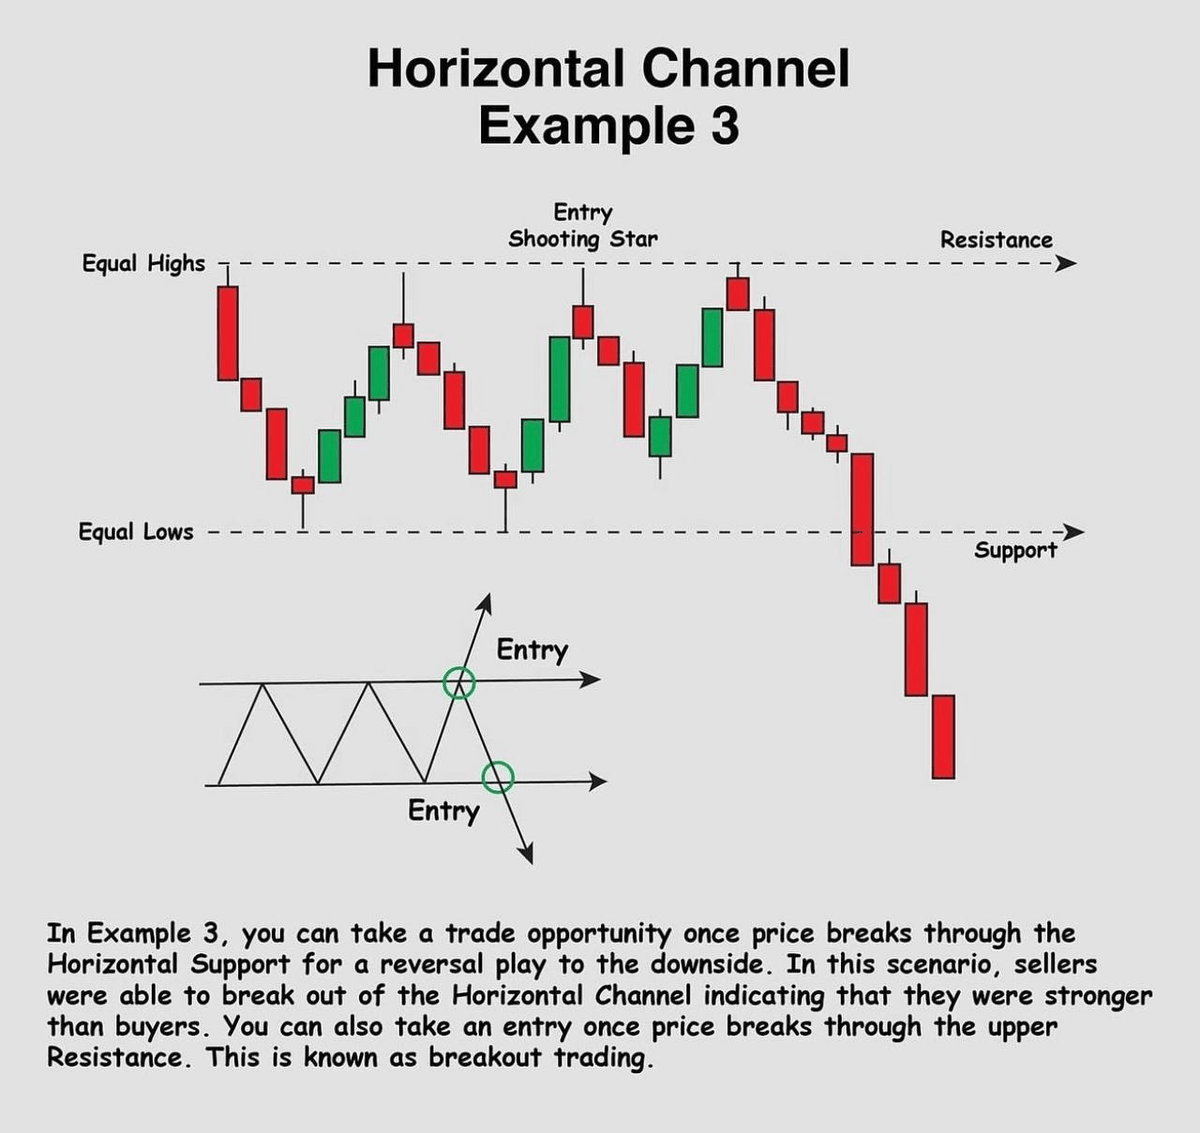
3.1 Trading Channels
When the Support or Resistance is broken in a trading channel with high volume, take the trade.
Some traders usually wait for the breakout to trade the end of this range. x.com
When the Support or Resistance is broken in a trading channel with high volume, take the trade.
Some traders usually wait for the breakout to trade the end of this range. x.com
3.2 Trading Channels
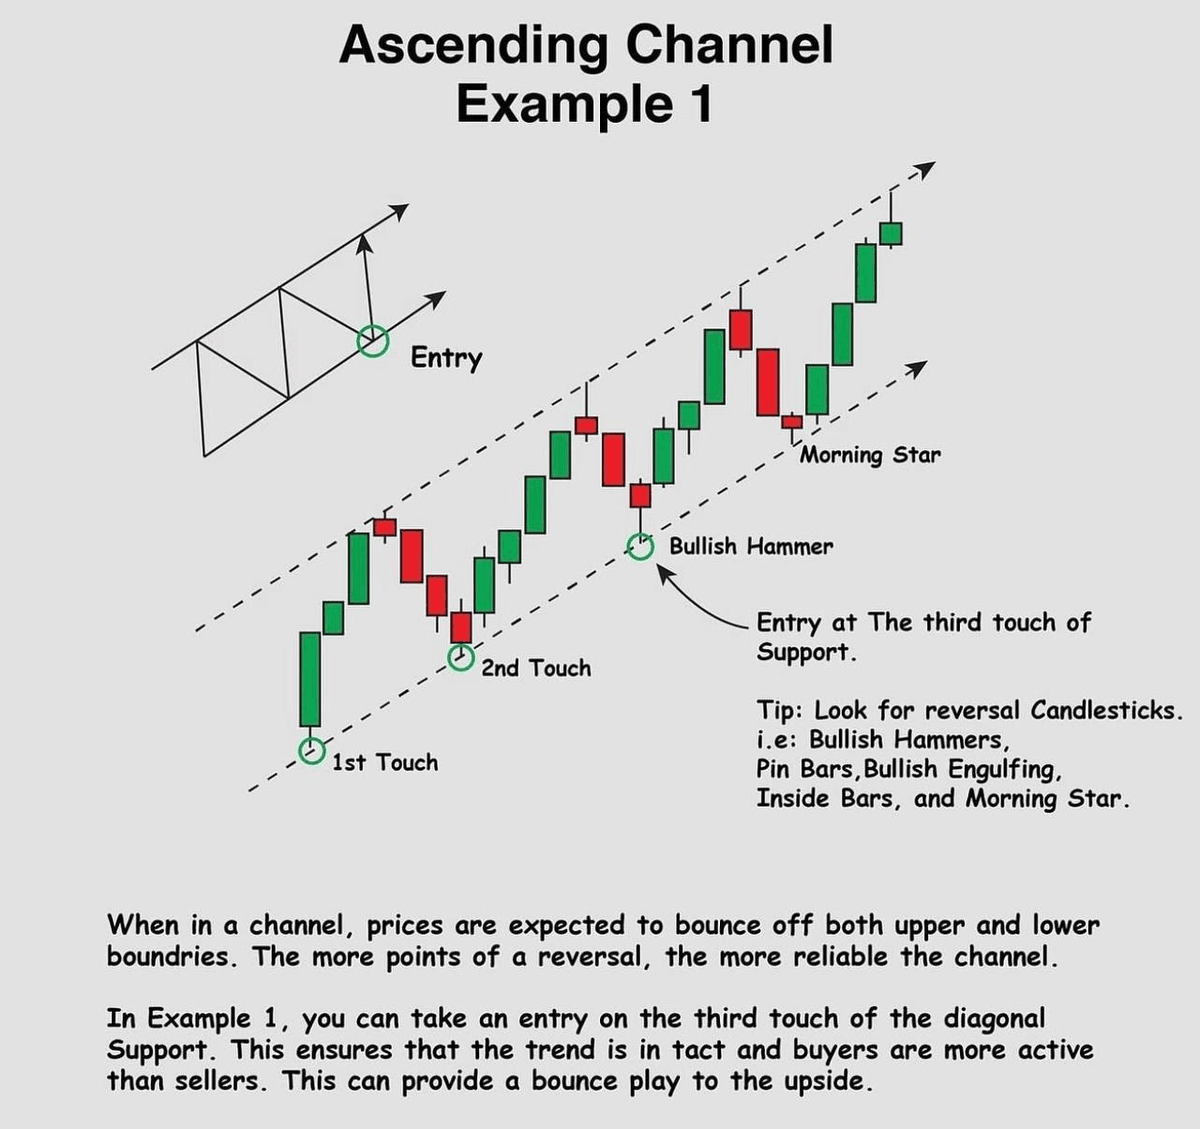
An ascending channel is the price action contained between upward sloping parallel lines.
Higher highs and higher lows characterize this price pattern.
Channels are used to confirm trends and identify breakouts and reversals. x.com
An ascending channel is the price action contained between upward sloping parallel lines.
Higher highs and higher lows characterize this price pattern.
Channels are used to confirm trends and identify breakouts and reversals. x.com
3.3 Trading Channels
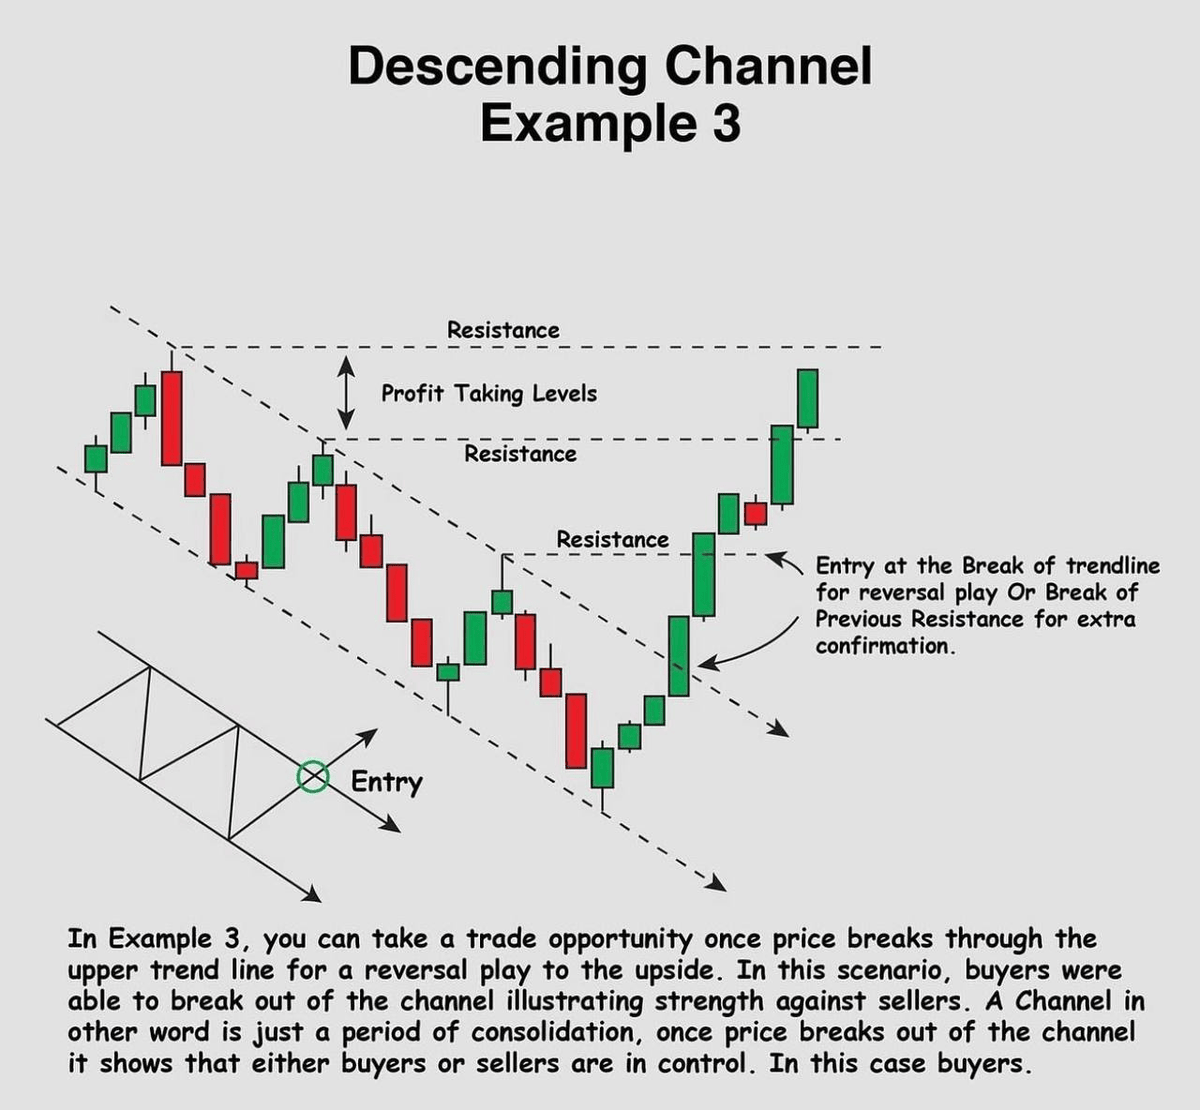
When the price breaks above the upper boundary of the descending channel, it may indicate a bullish breakout.
Traders can consider entering long positions, anticipating a potential upward trend continuation. x.com
When the price breaks above the upper boundary of the descending channel, it may indicate a bullish breakout.
Traders can consider entering long positions, anticipating a potential upward trend continuation. x.com
Loading suggestions...