

Prashant Shah
CMT, CFTe, MFTA®, MSTA. Author of four books. SEBI Regd RA & IA. Building @definedge
View on 𝕏Threads
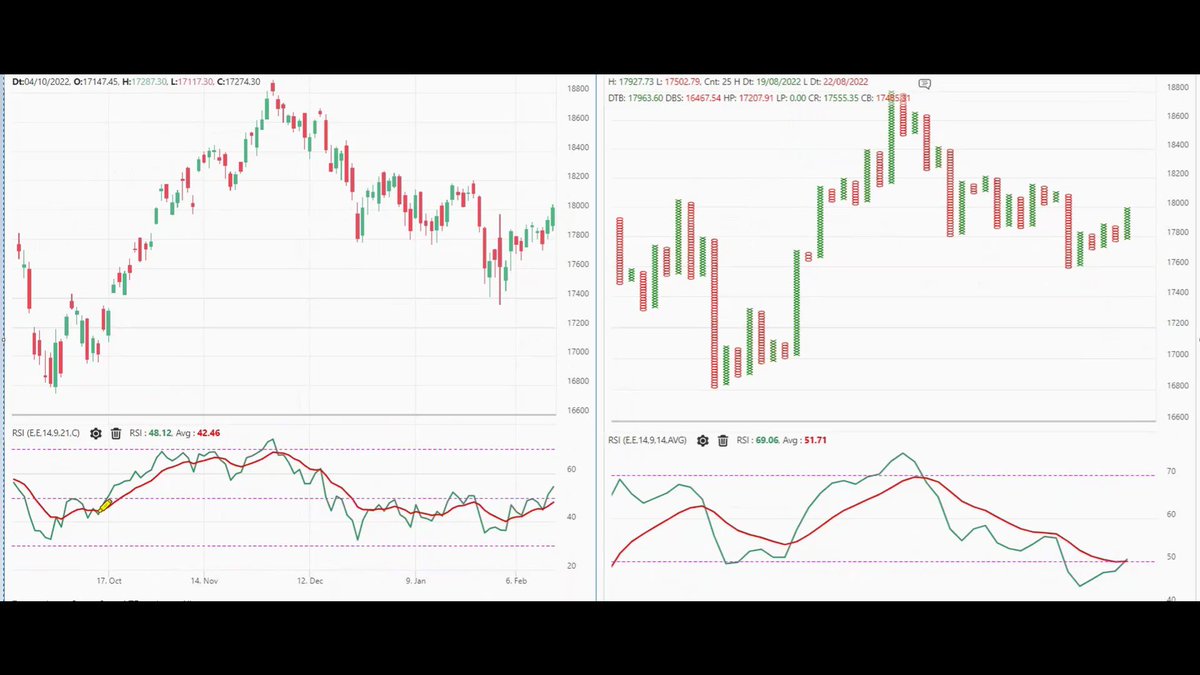
A new way to look at RSI. RSI is a very popular strength and momentum indicator. #RSI


Thread: True Strength Index (TSI) Indicator A combination of momentum (leading) and smoothing (lagging) qualities. (1/20) #Indicator #trading #investing #definedge https://t.co...
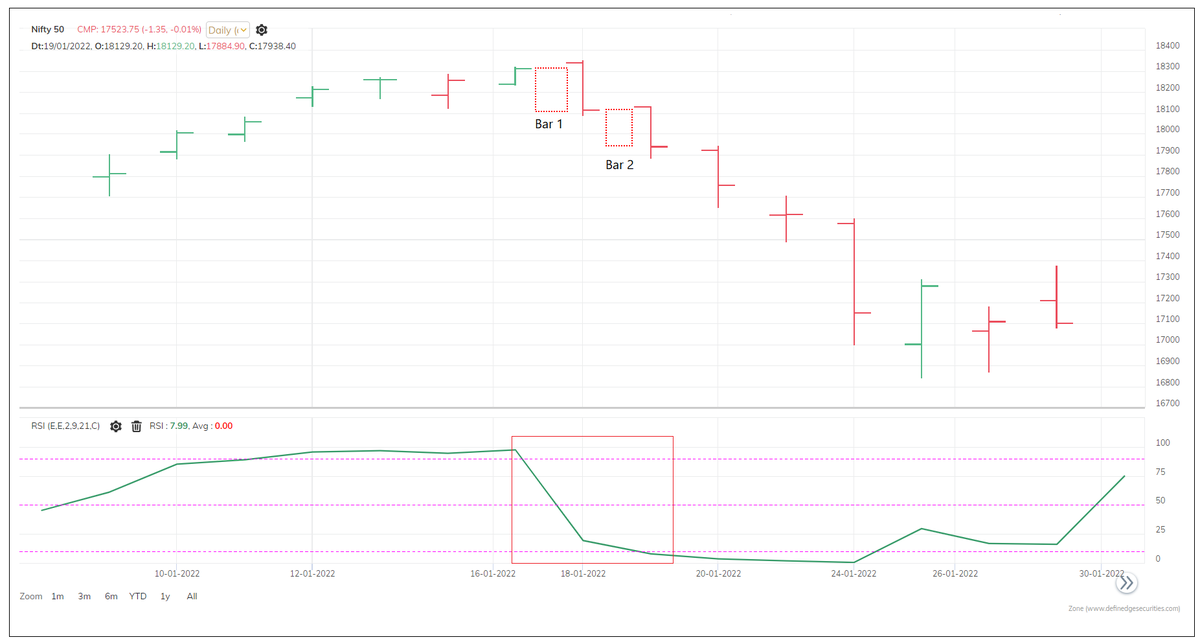
Thread: Decoding 2-period RSI #trading https://t.co/3SMyZCSQpY

Thread: Ulcer Index (UI) – Bears’ indicator, Exit indicator. Study of and indicator from learning perspective. Not so known but a useful indicator. https://t.co/Ir3e1UgOcV
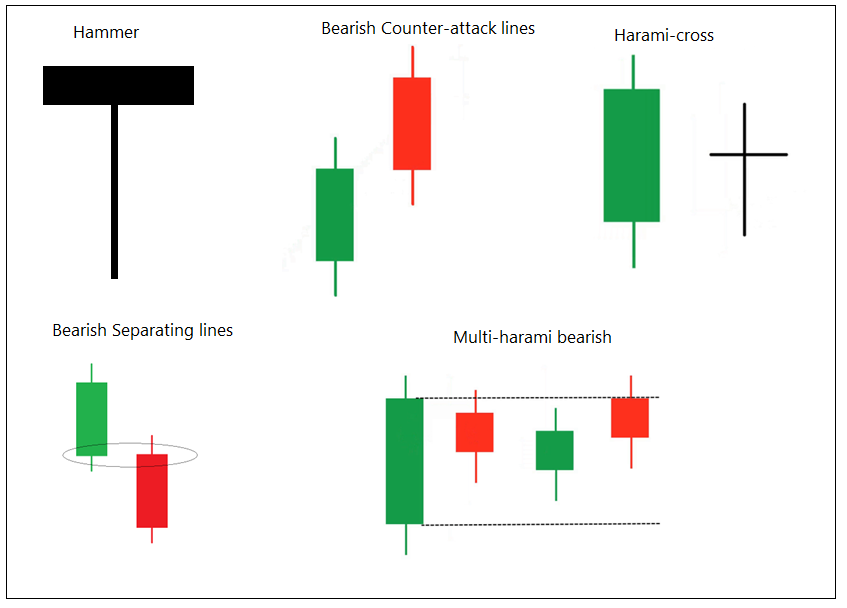
Back-testing of some candlestick patterns 🧵 I hv back-tested patterns shown below on 500 stocks (Nifty 500 stock group as on today) since inception on daily timeframe charts. Bel...
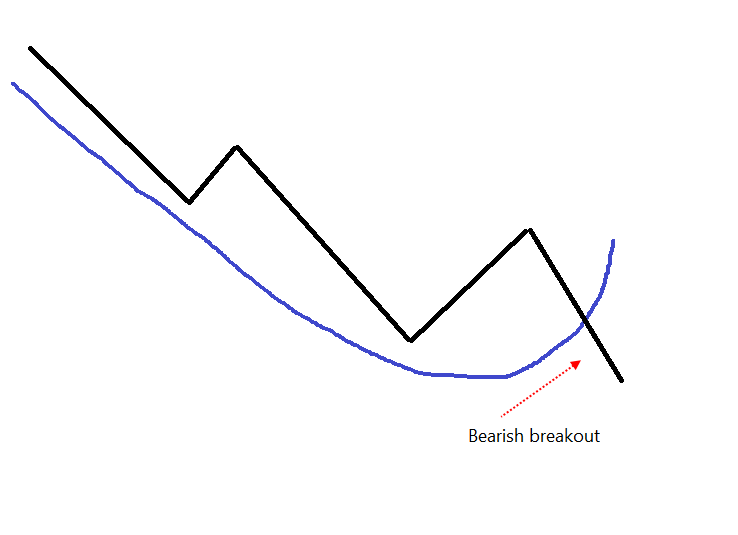
Thread: 5 Important bullish & bearish chart patterns in technical analysis. Triangles, Broadenings and Rectangles. #trading #investing
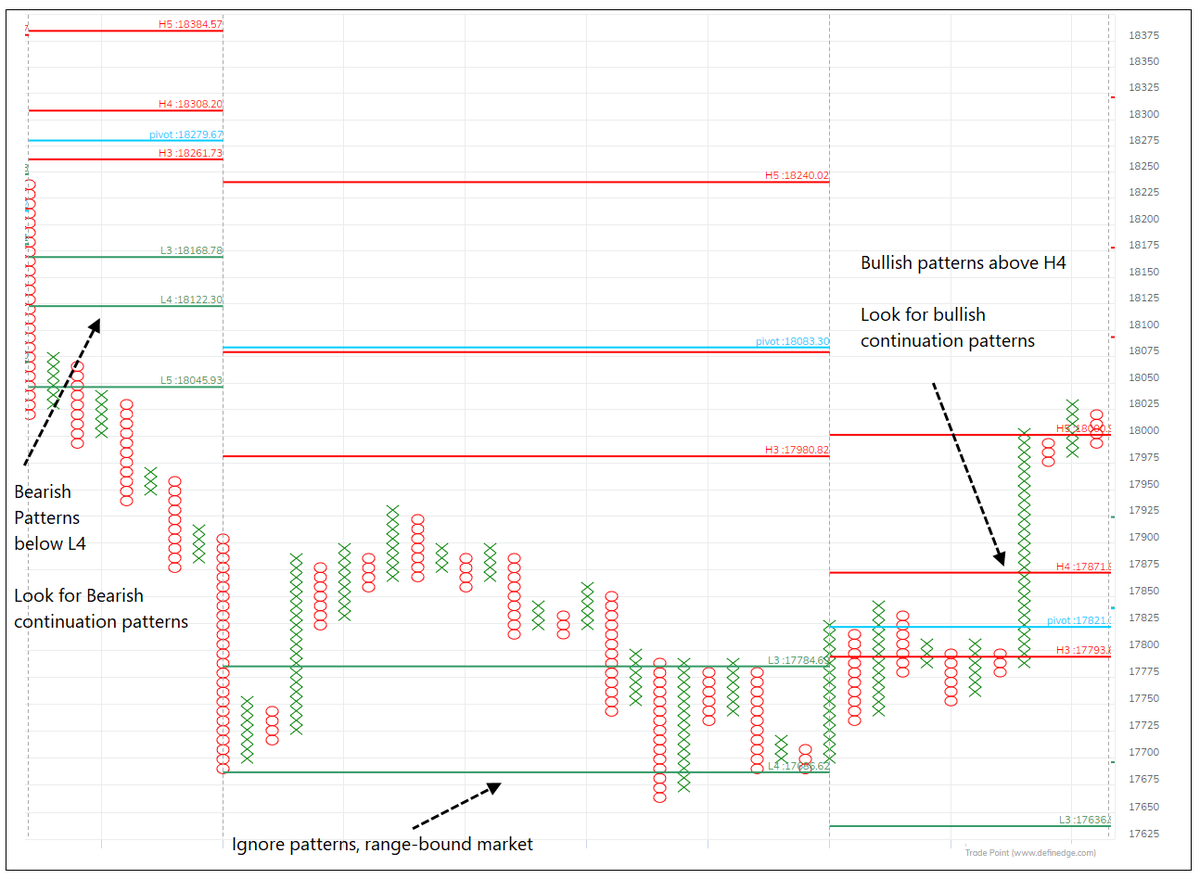
Thread: Camarilla Levels Continuing our discussion on pivot levels, we look at the Camarilla levels which is another widely followed tool. Word ‘Camarilla’ is borrowed from Span...
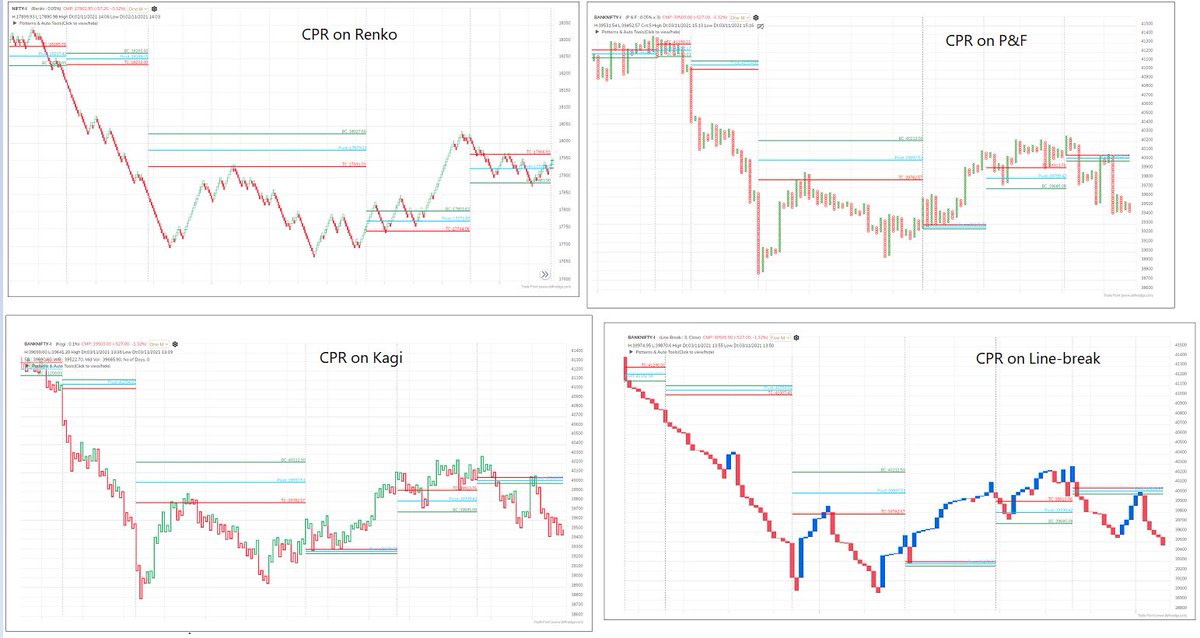
Thread: Central Pivot Range (CPR) CPR is another popular tool. Three lines are plotted on the chart when we plot CPR. The three lines are: CPR, TC and BC. Let’s understand the...
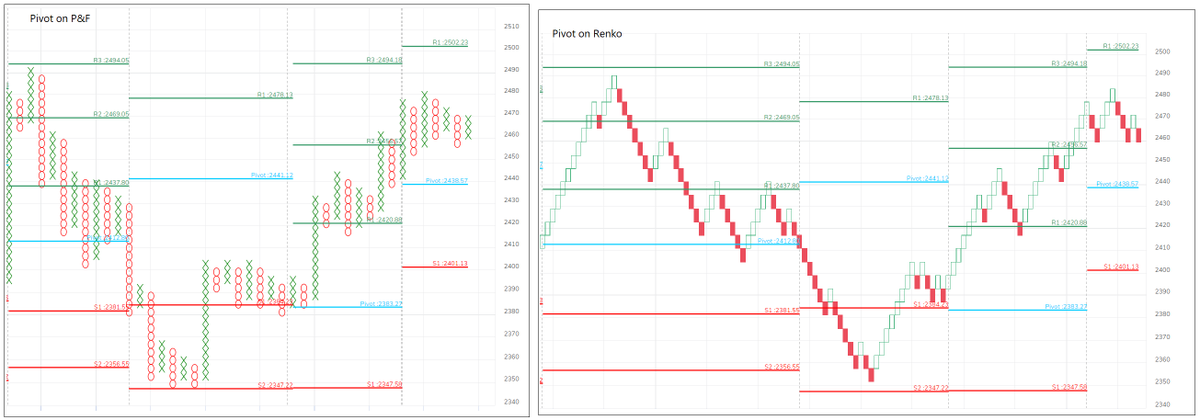
Thread: Pivot levels Trading based on Pivot levels is one of the popular approaches. Both short-term and intraday traders track Pivot levels to identify support and resistance lev...
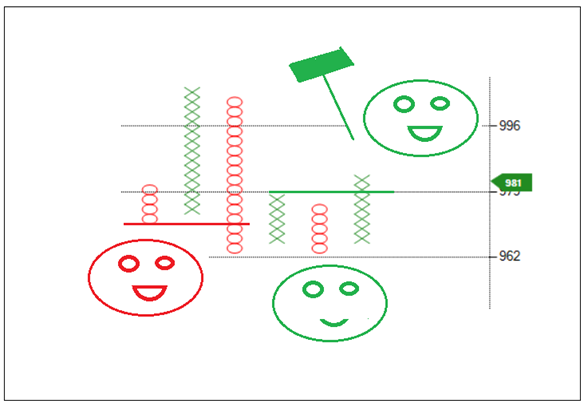
Thread: Strike-back Pattern P&F pattern explained via images. https://t.co/aMqUlFa3kM

Thread: Alligator indicator #Alligator #Indicators #Definedge https://t.co/7VSo1b5er4
Index is in consolidation zone. Nifty 500 and Midcaps - Smallcaps showing signs of outperformance. Below are outputs in Darvas scanner of Nifty 500 universe. Example of further...