

Thread: Decoding 2-period RSI
#trading
#trading
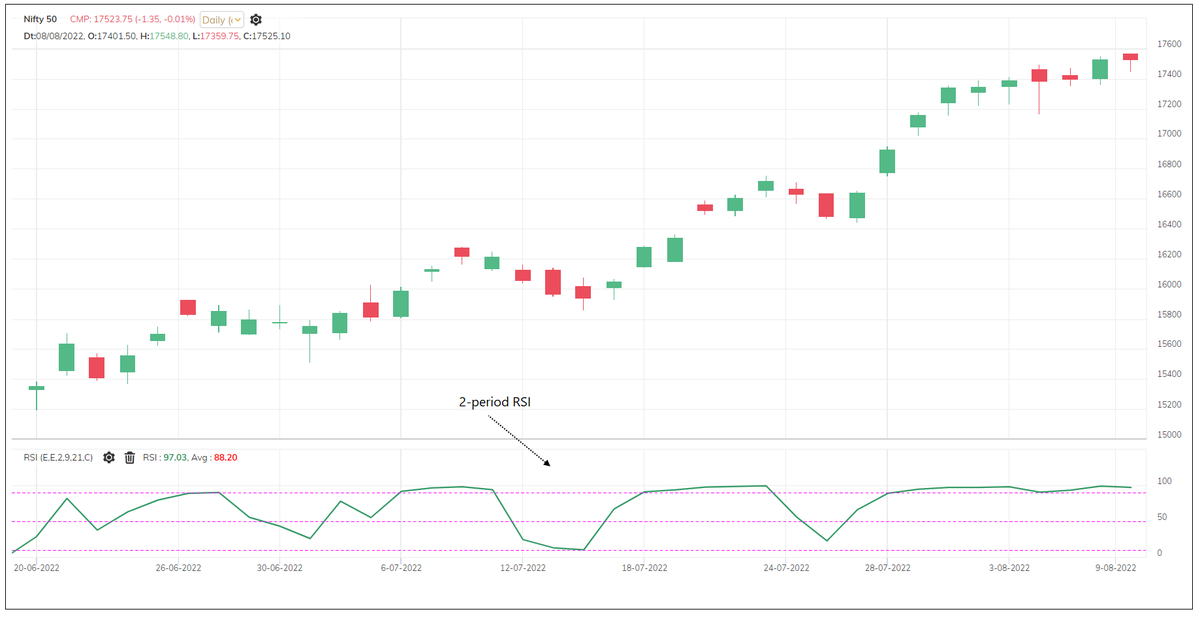
2-period RSI is a popular concept introduced by Larry Connors.
Many traders are using this method in their strategy.
There are two simple rules in the strategy that Larry Connors explained.
Many traders are using this method in their strategy.
There are two simple rules in the strategy that Larry Connors explained.
For buying:
• Price should be above 200-DMA (Long-term trend is up)
• 2-period RSI should be below 10 (better below 5)
For selling:
• Price should be below 200-DMA (Long-term trend is up)
• 2-period RSI should be above 90 (better above 95)
• Price should be above 200-DMA (Long-term trend is up)
• 2-period RSI should be below 10 (better below 5)
For selling:
• Price should be below 200-DMA (Long-term trend is up)
• 2-period RSI should be above 90 (better above 95)
He also recommended exiting trades in profit. Exit if stock goes above 5 DMA after buying and exit of stock goes below 5 DMA after shorting. You can use DMA, higher period RSI such as 5 period or 14 period, ADX, Super trend etc. Possibilities are endless.
Bottom line is that he recommended exiting into profit instead of trailing. He did not recommend stop-loss because it can hurt the overall profitability according to him.
Let’s focus on the 2 rules stated above.
What is the logic of the system? It is a pullback trading system.
Let’s focus on the 2 rules stated above.
What is the logic of the system? It is a pullback trading system.
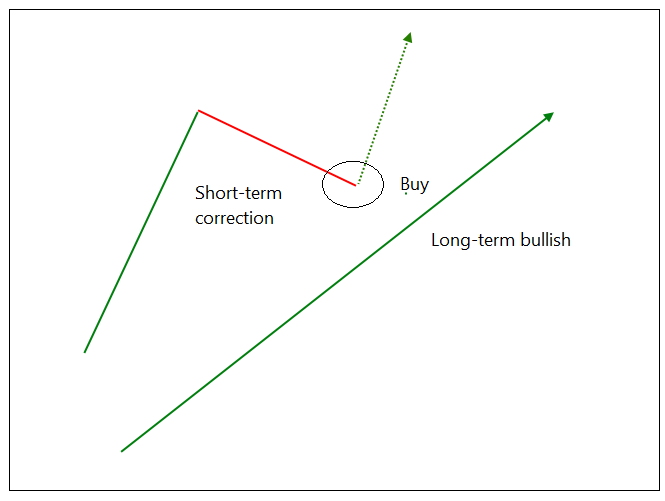
Price above 200 DMA means long-trend is bullish. Price below 10 RSI means there is a short-term price correction. It is a bullish pullback trade system.
Same way, shorting strategy needs long-term trend down (below 200 SMA) but price has gone up in the short-term (RSI above 90).
Same way, shorting strategy needs long-term trend down (below 200 SMA) but price has gone up in the short-term (RSI above 90).
This strategy can be easily back-tested and there are many variations that can be applied to improve it. But that’s not the objective of this post. You know the rules of the strategy, think about the price pattern it produces.
200 DMA is simple. What does 2-period RSI show?
200 DMA is simple. What does 2-period RSI show?
Larry Connors said in his book ‘How Markets Really Work’ that “Even though we do not suggest using only one indicator, if one had to, the 2-period RSI would be the indicator”.
First, you need to understand the RSI calculation. Explained in this thread.
First, you need to understand the RSI calculation. Explained in this thread.
2-period RSI is calculated on last 2 candles.
RSI indicator calculates Gain v/s Loss in the price. Only closing price is considered in this calculation hence the Gains & Losses are calculated on the closing price. In this context, looking at Bar chart would be better.
RSI indicator calculates Gain v/s Loss in the price. Only closing price is considered in this calculation hence the Gains & Losses are calculated on the closing price. In this context, looking at Bar chart would be better.

Candlestick chart color depends on the Open & close of the candle.
Close > Open = Bullish candle
Close < Open = Bearish candle
The bar chart color depends on the closing price of current and the previous bar.
Close > Prev Close = Bullish bar
Close < Prev Close = Bearish bar
Close > Open = Bullish candle
Close < Open = Bearish candle
The bar chart color depends on the closing price of current and the previous bar.
Close > Prev Close = Bullish bar
Close < Prev Close = Bearish bar
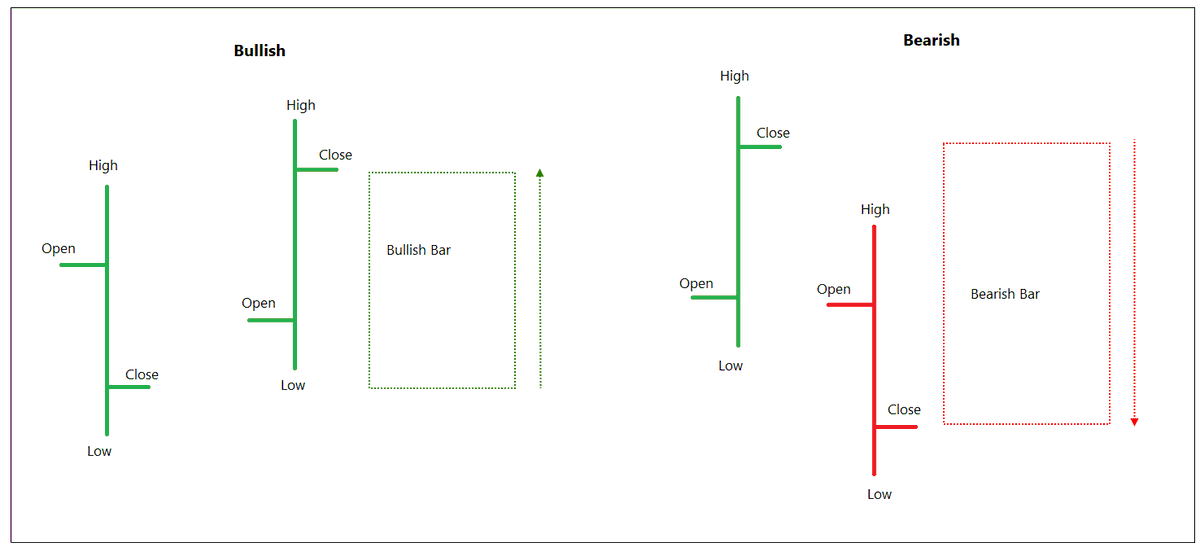
RSI is also calculated on closing price hence the bar chart can help one to understand the formation.
As said earlier, RSI is about Gain v/s loss. It shows how much are gains compared to total movement in the price.
As said earlier, RSI is about Gain v/s loss. It shows how much are gains compared to total movement in the price.
In simple words, if Gain is greater than the loss, RSI would be rising and number would be high. If loss is greater than the gain, RSI would be falling and number would be low.
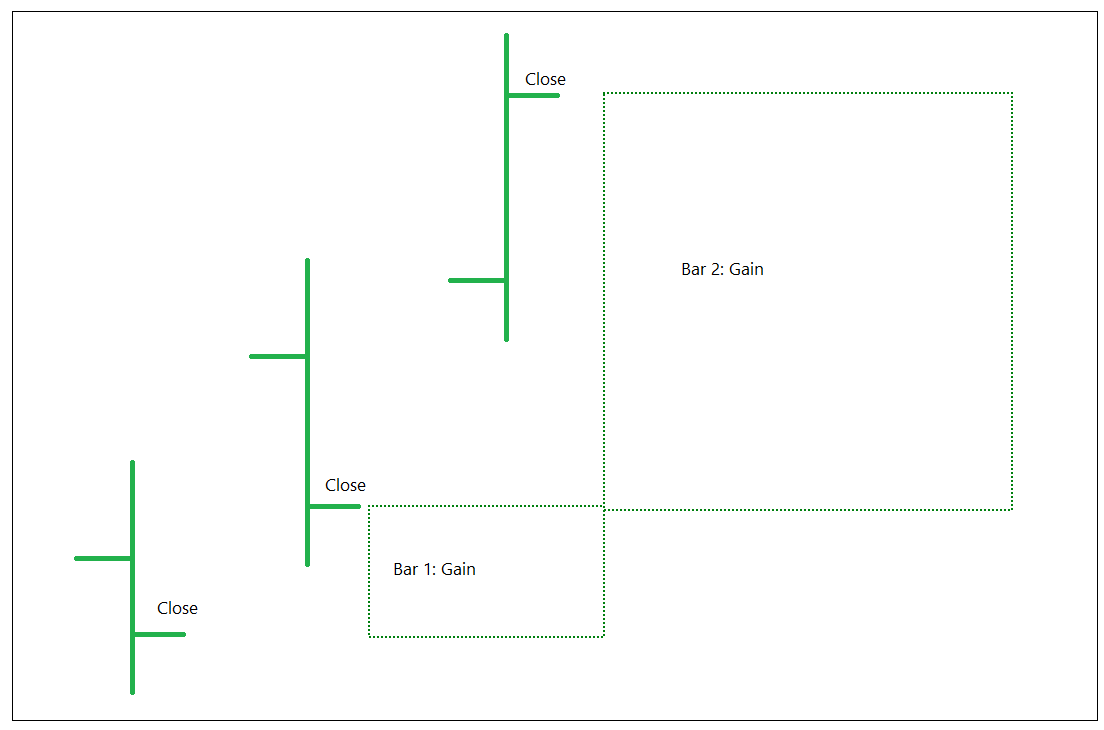
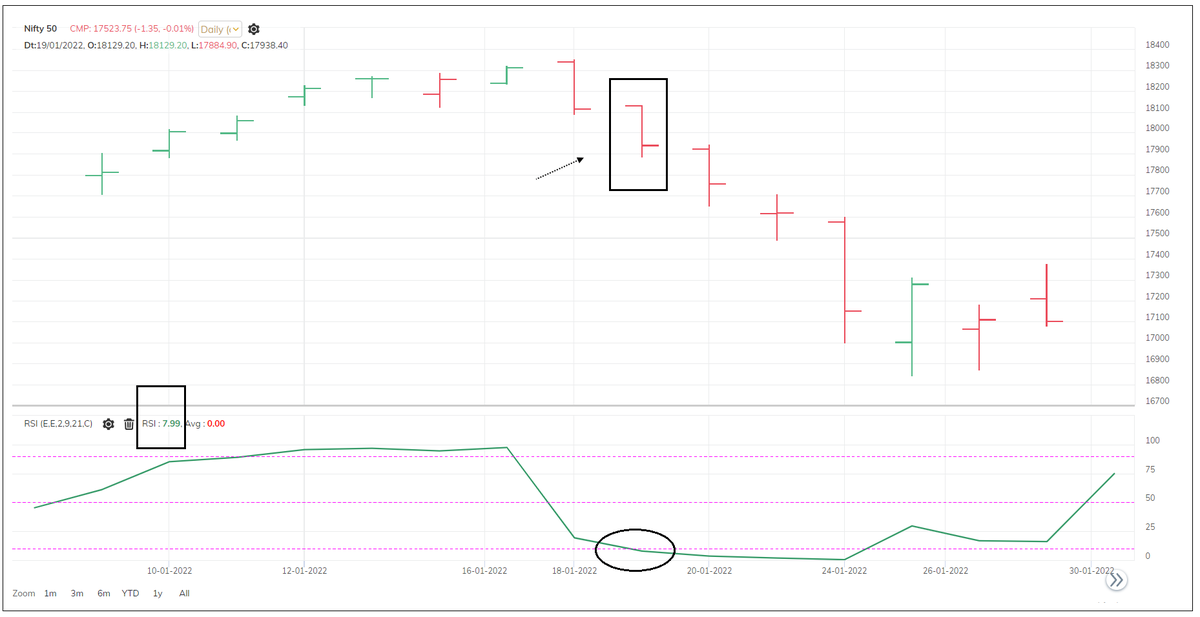
2-period RSI would calculate the gain and loss of last two bars. Have a look at below picture.
2-period RSI would calculate the gain and loss of last two bars. Have a look at below picture.
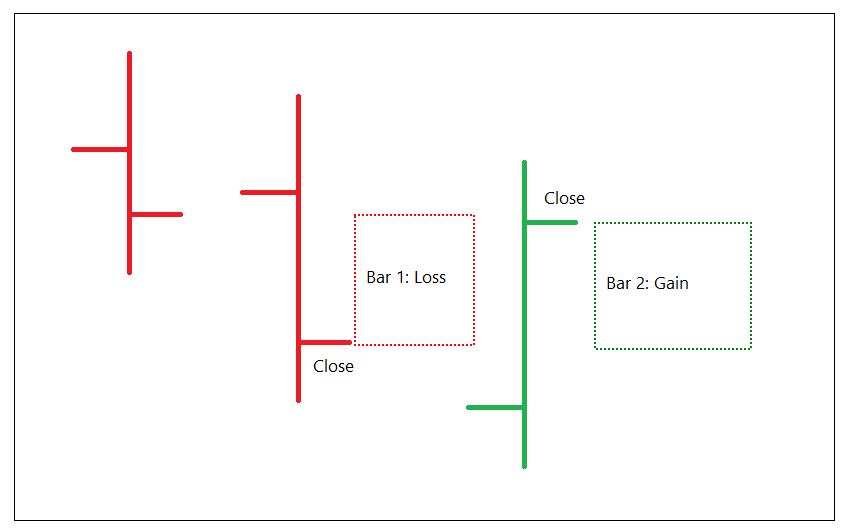
In the earlier tweet image, Bar 1 has recorded loss (close below previous bar) and Bar 2 has recorded gain (Close above previous bar). None of them is dominating hence RSI would be moderate in this case.
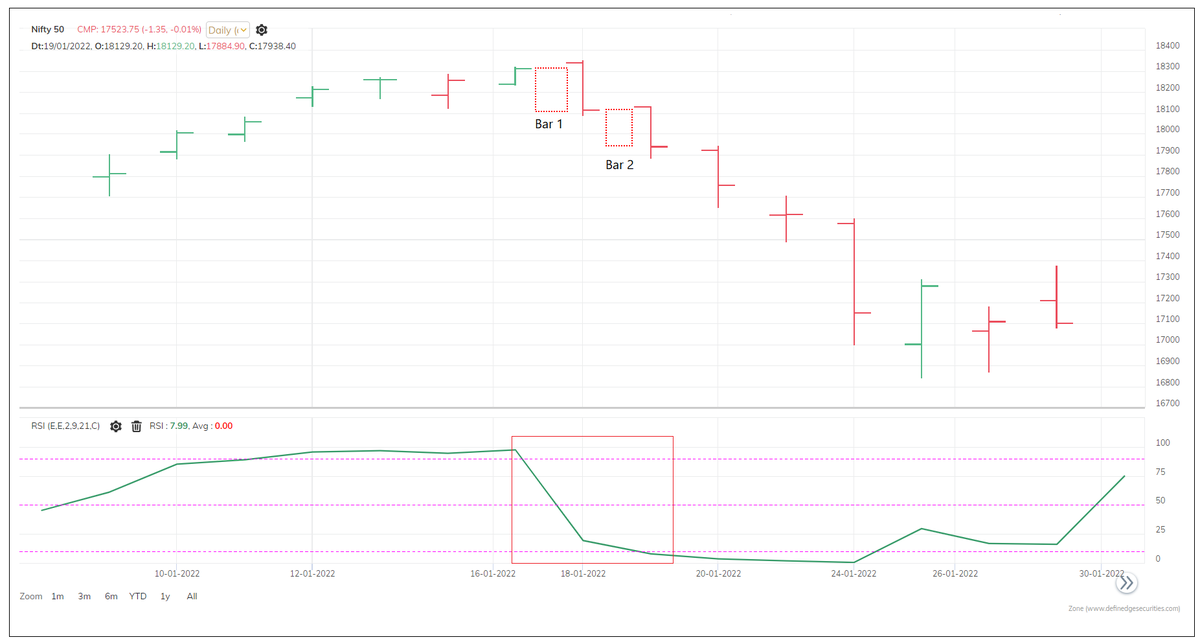
Observe below image.
Observe below image.
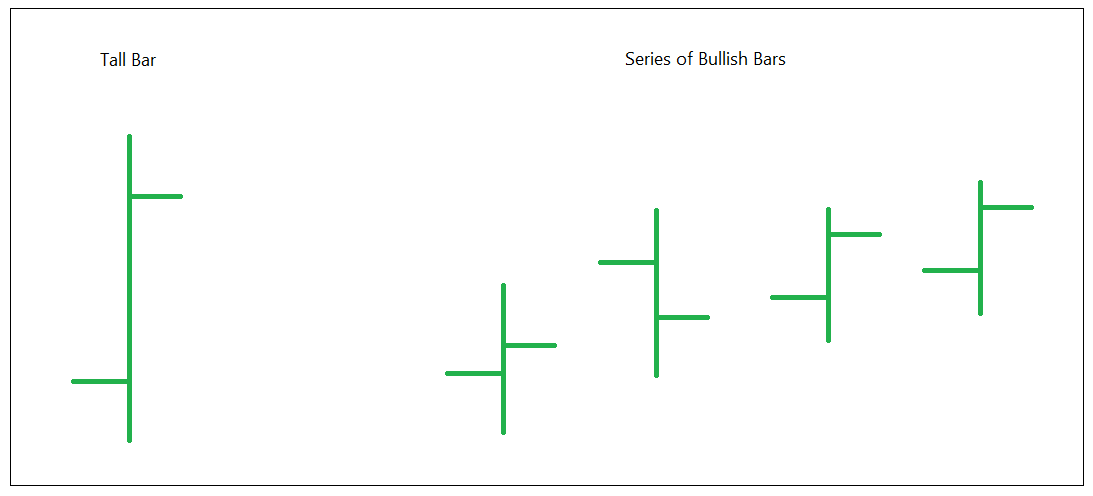
Both bars are bullish in the earlier image. There is only gain in last two bars. RSI also considers previous RSI reading for the calculation hence RSI wouldn’t be 100 but it will be significantly high.
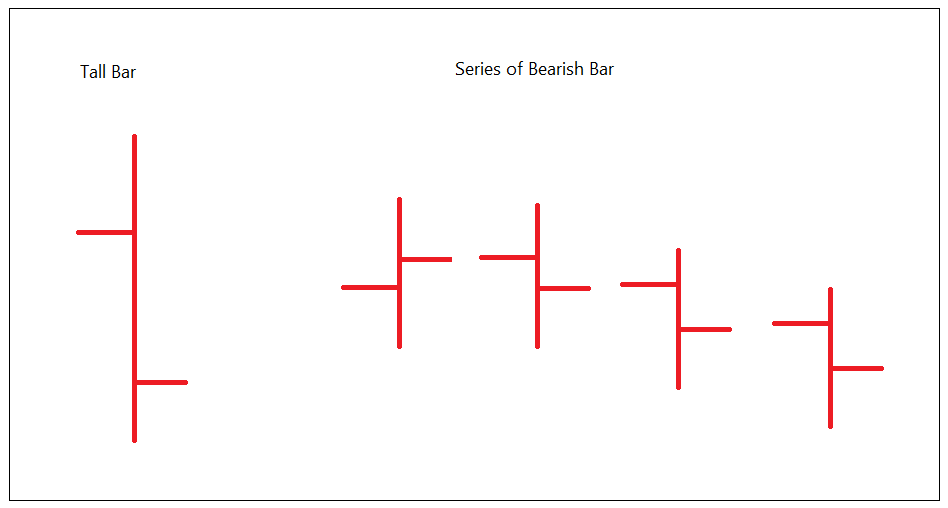
In case of below image, RSI would be significantly low.
In case of below image, RSI would be significantly low.
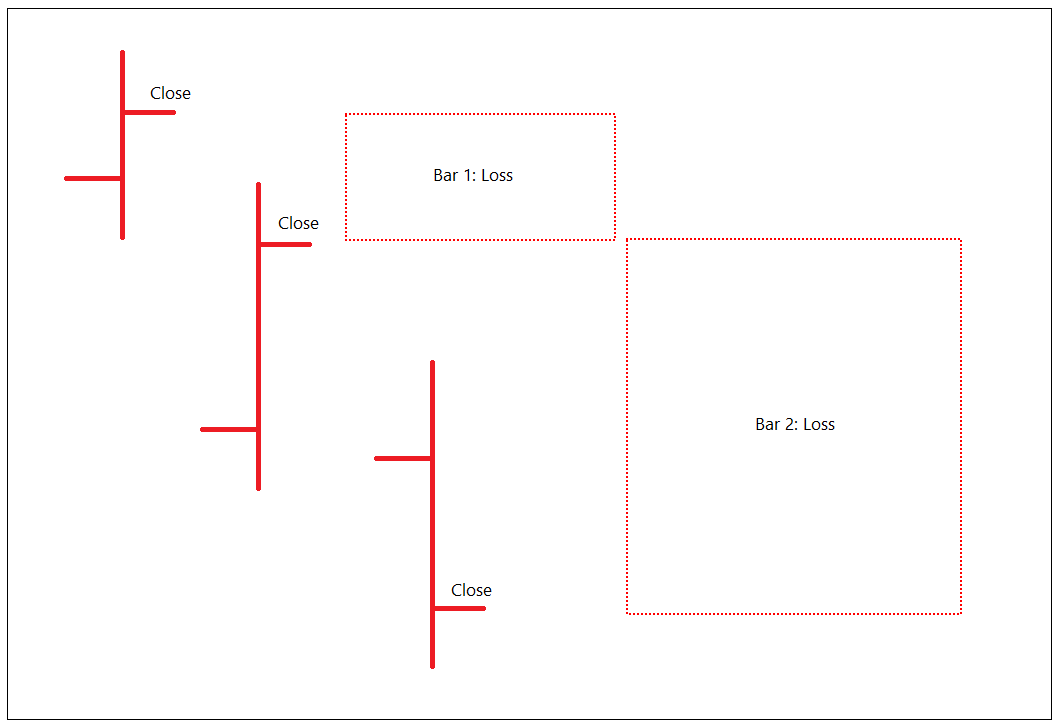
The length of bar is important for the calc.
A tall green bar would be v bullish & result in bullish reading of RSI. A tall red bar would result in a bearish reading of RSI.
But tall is a relative term. It depends on the length of the earlier bars.
Have a look at below images
A tall green bar would be v bullish & result in bullish reading of RSI. A tall red bar would result in a bearish reading of RSI.
But tall is a relative term. It depends on the length of the earlier bars.
Have a look at below images
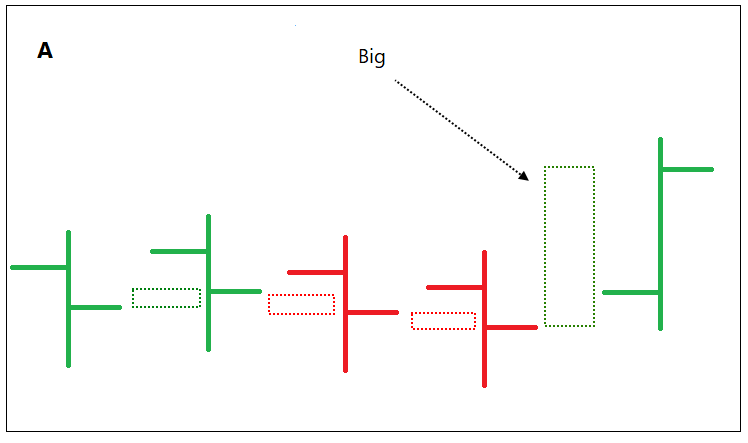
In the image A, Bar is bullish because the move is high compared to earlier bar trends.
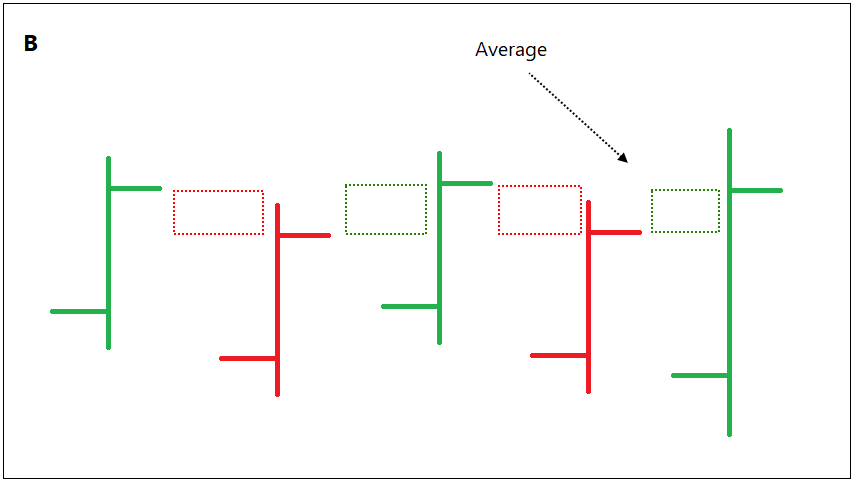
In the image B, move is average despite of large bar in size because the trend was more or less same in comparison with earlier bars.
In the image B, move is average despite of large bar in size because the trend was more or less same in comparison with earlier bars.
In nutshell, RSI would be above 90 when there is a tall bar or series of bullish bars because the gains will be much more compared to loss in the calculation.
Similarly, RSI would be below 10 if there is a tall bar or series of bearish bars.
Similarly, RSI would be below 10 if there is a tall bar or series of bearish bars.
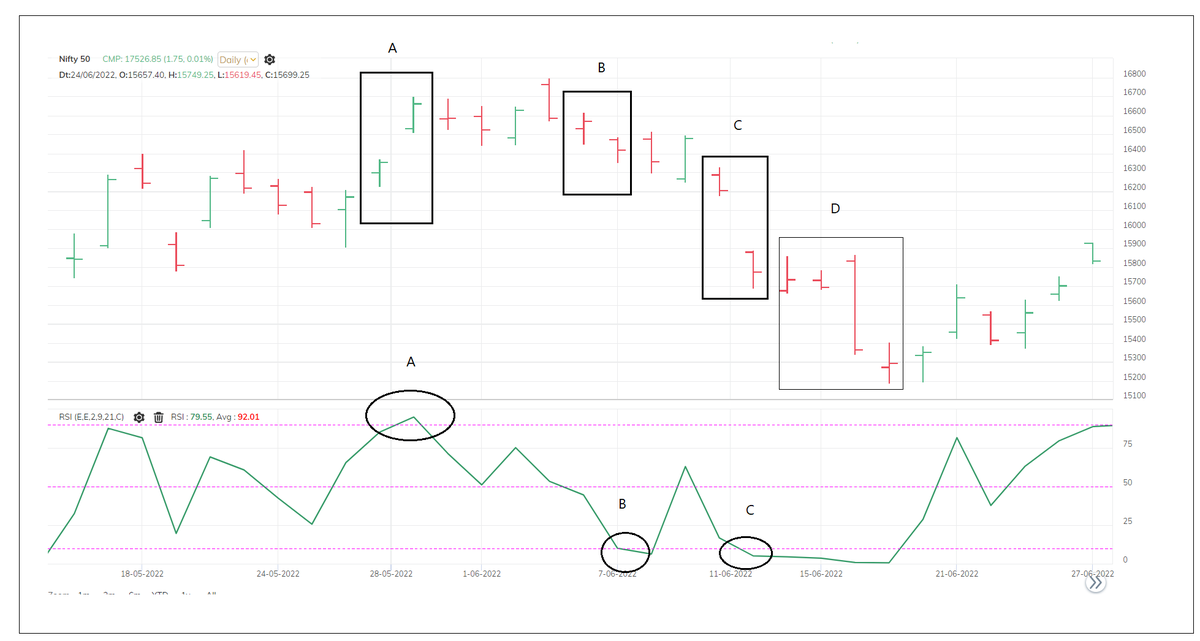
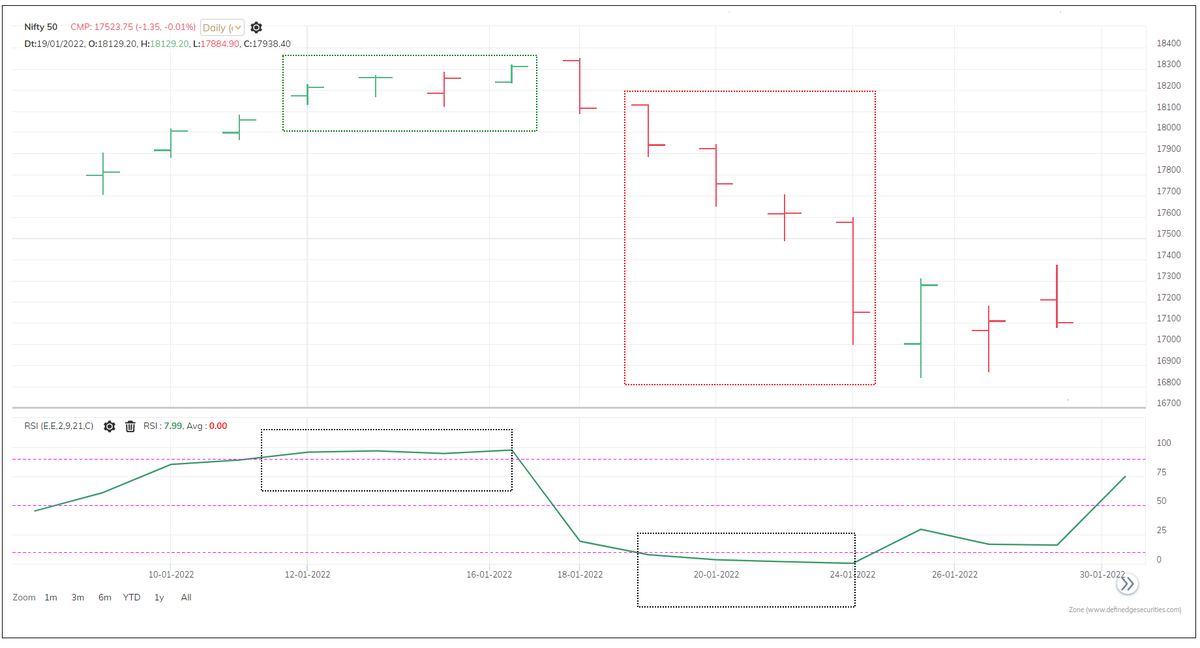
Observe below chart after studying above:
2-RSI in case of A is above 90 because of strong gains.
Below 10 at B because of comparatively higher declines.
Wide bearish range resulted in RSI below 10 at C. Observe D, series of bearish bars (see the tall bar) & RSI stayed below 10
2-RSI in case of A is above 90 because of strong gains.
Below 10 at B because of comparatively higher declines.
Wide bearish range resulted in RSI below 10 at C. Observe D, series of bearish bars (see the tall bar) & RSI stayed below 10
Exercise for you.
Check below chart and guess on which chart RSI would have gone below 10 in the bearish trend?
Check below chart and guess on which chart RSI would have gone below 10 in the bearish trend?
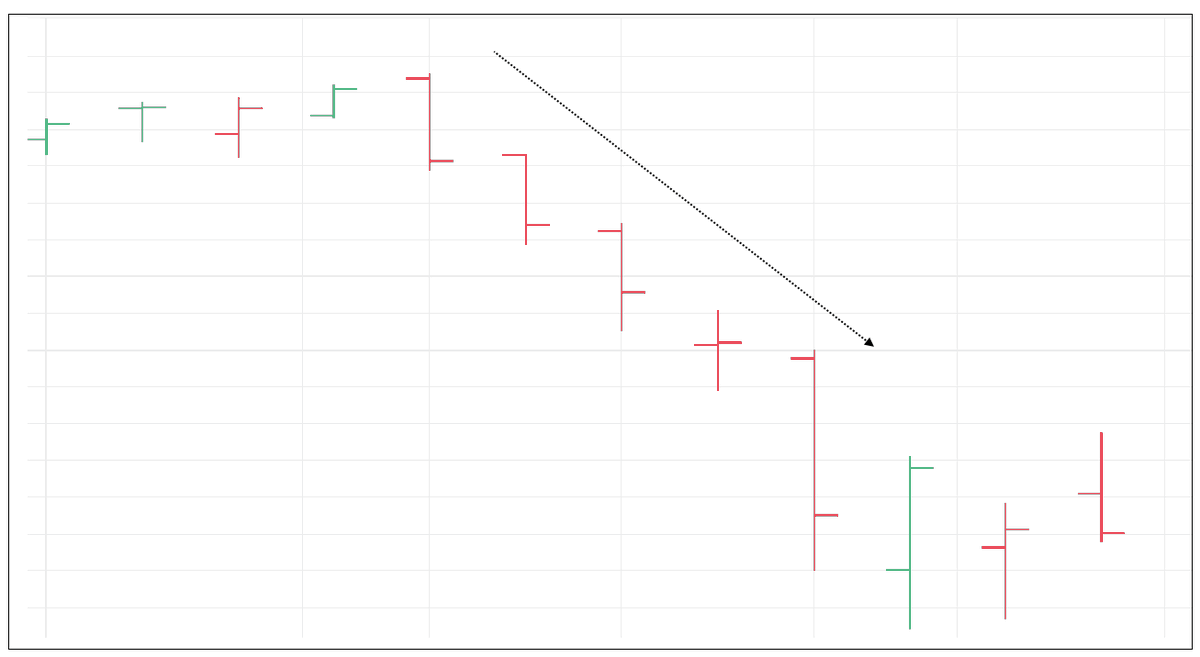
Answer is below.
Bar 1 and 2 were declining and they were tall bars compared to earlier bars.
In same chart, also observe price patterns when RSI remained above 90 and below 10.
In same chart, also observe price patterns when RSI remained above 90 and below 10.
Try this: guess the RSI levels by just observing the price pattern. The objective of this post is not to explain importance of 2-period RSI. We can’t trade many systems but we can learn the principles of the different systems & apply that thinking in the methods that we practice.
If you have understood the concept, you can use it for continuation, pullback or mean reversion trades. You may not even use it but now you know well abt it.
Friends who know about P&F - how will 2-RSI behave on it. There is a 2-column pattern indicating extreme RSI readings.
Friends who know about P&F - how will 2-RSI behave on it. There is a 2-column pattern indicating extreme RSI readings.
Loading suggestions...