

Thread: Know Heikin-Ashi chart.
Heikin-Ashi charts are said to have been developed by Munehisa Homma in 18th century by a Japanese rise trader. Hence, it is another old Japanese charting method.
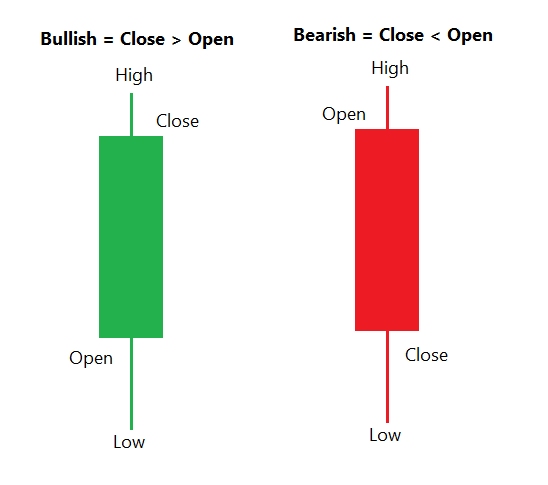
Heikin-Ashi candles are built from candlestick chart. A candle in candlestick chart is made of four prices OHLC.
Heikin-Ashi candles are built from candlestick chart. A candle in candlestick chart is made of four prices OHLC.
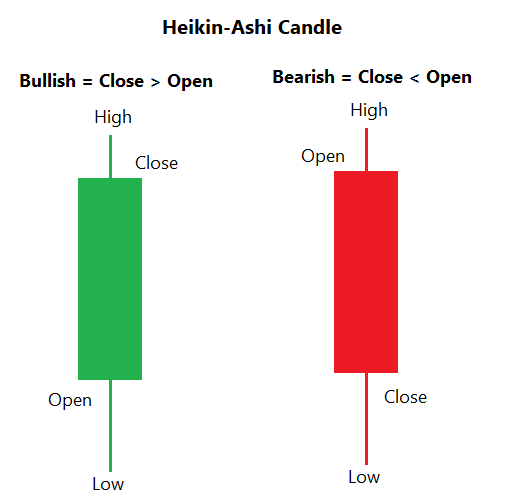
A Heikin-Ashi (HA) candle is also made of four prices (OHLC) but calculated using the candlestick chart data.
It is calculated in this sequence: OCHL (Open, Close, High, Low).
It is calculated in this sequence: OCHL (Open, Close, High, Low).
So, we have two types of candle data every day :
Candlestick data and Heikin-ashi candlestick data.
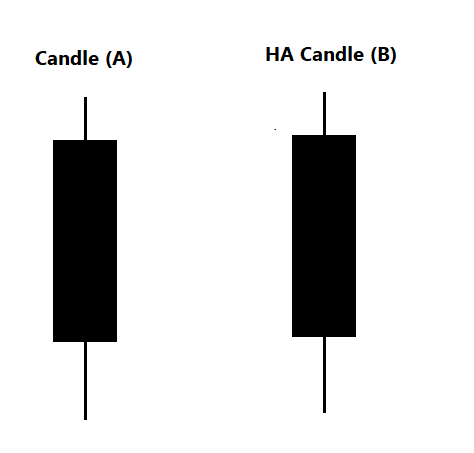
To avoid confusion, lets call Candlestick chart data as Candle (A) and Heikin-Ashi candle data as HA Candle (B).
Candlestick data and Heikin-ashi candlestick data.
To avoid confusion, lets call Candlestick chart data as Candle (A) and Heikin-Ashi candle data as HA Candle (B).
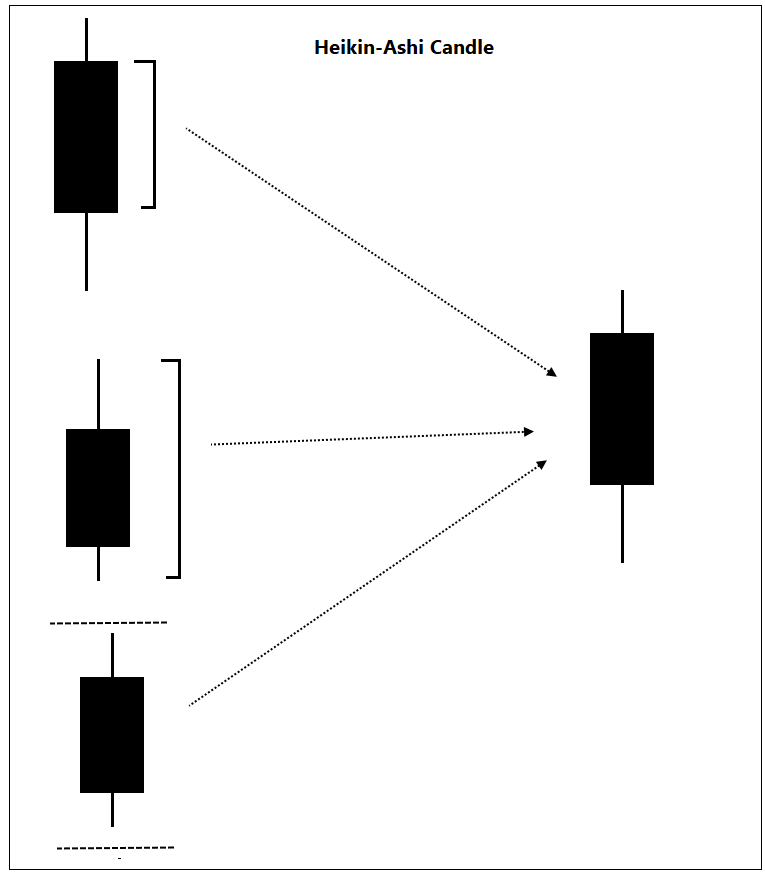
Let’s see how Heikin-Ashi candle is constructed. As said earlier, It is calculated in OCHL sequence :
Open:
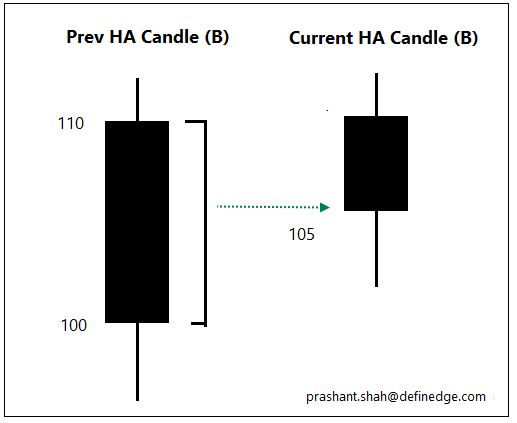
Open is average price of previous HA candle (B) body. Body of a candle is difference between Open and Close. It is bullish when close is higher than open.
Open:
Open is average price of previous HA candle (B) body. Body of a candle is difference between Open and Close. It is bullish when close is higher than open.
In other words, Open of HA candle is an average price of Open and Close of previous HA (B) candle.
Eg: Open prev HA candle is 100 and close is 110, Open of current HA candle will be 105.
This is why you will always see HA candle open as a mid-point of previous candle.
Eg: Open prev HA candle is 100 and close is 110, Open of current HA candle will be 105.
This is why you will always see HA candle open as a mid-point of previous candle.
Close:
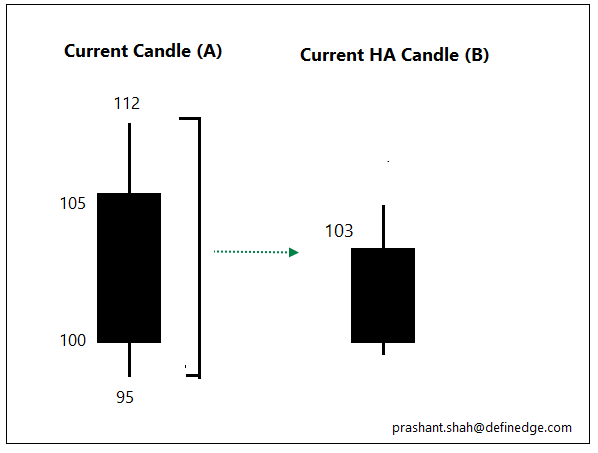
Close of HA candle is an average price of Open, High, Low and Close price of current candle (A).
Bullish or bearish candle (A) wouldn’t have impact on Open & Close price calculation of HA candle.
Close of HA candle is an average price of Open, High, Low and Close price of current candle (A).
Bullish or bearish candle (A) wouldn’t have impact on Open & Close price calculation of HA candle.
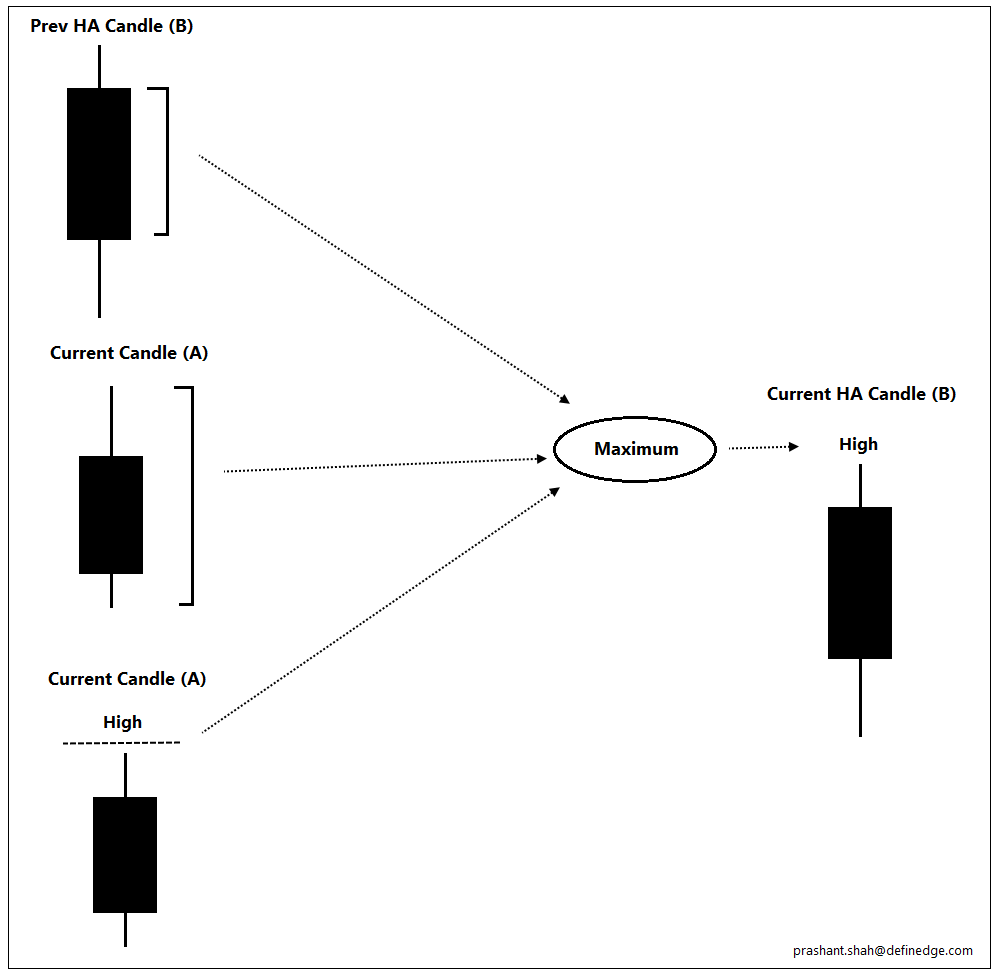
High:
Three prices are taken into account for this
*Open of current HA candle chart (B)
*Close of current HA candle chart (B)
*High of current candlestick chart (A)
Meaning, Max of (Ave price of prev HA candle body, OHLC ave price of current candle, High price of current candle)
Three prices are taken into account for this
*Open of current HA candle chart (B)
*Close of current HA candle chart (B)
*High of current candlestick chart (A)
Meaning, Max of (Ave price of prev HA candle body, OHLC ave price of current candle, High price of current candle)
If I calculate it on data of Nifty since inception, High price of more than 75% Heikin-Ashi candles is High price of candlestick chart (A). And rest is difference between prev Heikin-Ashi candle (B) body.
In simple words, high price of HA candle (B) will be same as high price of usual candle chart (A) unless price gaps down and high price remains below the ave price of prev Hekin-Ashi candle (B) body.
So, there are two possibilities:
Scenario 1: High price is candlestick chart (A) high.
Scenario 2: High price is prev HA candle (B) ave price.
Important: A Heikin-Ashi candle will have upper shadow in first scenario. There will be no upper shadow in case of second scenario.
Scenario 1: High price is candlestick chart (A) high.
Scenario 2: High price is prev HA candle (B) ave price.
Important: A Heikin-Ashi candle will have upper shadow in first scenario. There will be no upper shadow in case of second scenario.
Now do you understand why few Heikin-Ashi candles have upper shadows and others don’t?
Do you now understand why they say no upper shadow in HA candle is bearish. Because current high is even lesser than the prev HA candle (B) average.
Do you now understand why they say no upper shadow in HA candle is bearish. Because current high is even lesser than the prev HA candle (B) average.
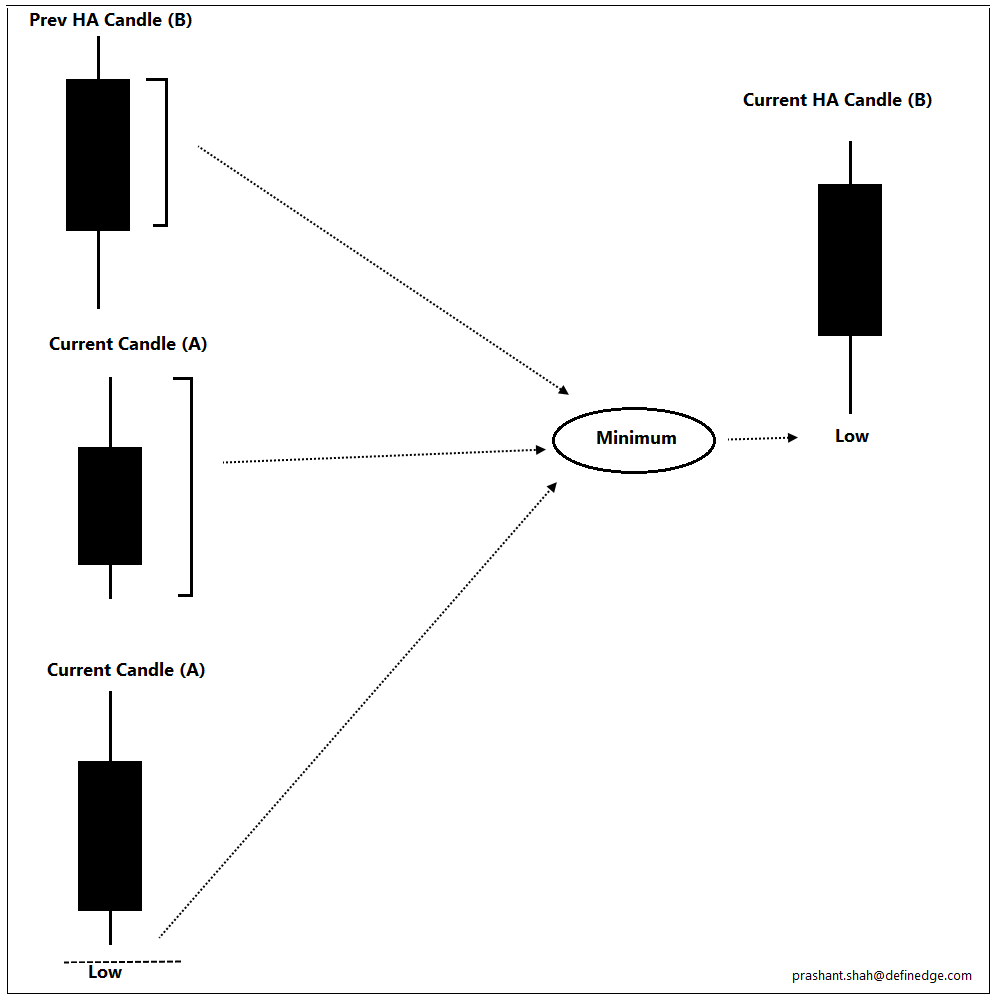
Low:
Three prices are taken into account for this:
Minimum of below is low of a HA candle:
*Open of current HA candle chart (B)
*Close of current HA candle chart (B)
*Low of current candlestick chart (A)
Three prices are taken into account for this:
Minimum of below is low of a HA candle:
*Open of current HA candle chart (B)
*Close of current HA candle chart (B)
*Low of current candlestick chart (A)
In most of the cases, low price of HA candle (B) is low price of the current candle (A). In other cases, it is average of prev HA candle body (B).
In the first scenario, HA candle will have lower shadow, in latter case, it will not have lower shadow.
In the first scenario, HA candle will have lower shadow, in latter case, it will not have lower shadow.
Hope this explains how a HA chart is constructed. For me, this is the most important part to design system on any chart.
Now, can you understand below statement?:
Heikin-Ashi candle will be bullish if average price of current candle (A) is higher than prev HA candle (B) body?
Now, can you understand below statement?:
Heikin-Ashi candle will be bullish if average price of current candle (A) is higher than prev HA candle (B) body?
Now think,
What does it mean when body of Heikin-Ashi candle is small, or very large?
How shadows of Heikin- Ashi candle would behave?
What does it mean when lower shadow is deep?
What does it mean when body of Heikin-Ashi candle is small, or very large?
How shadows of Heikin- Ashi candle would behave?
What does it mean when lower shadow is deep?
If you will study this, you will understand the strategies explained on Heikin-Ashi charts in a much better way. Lack of conviction & consistency also comes from lack of understanding of the subject.
I hope you found it useful. If you liked it, I can write about some nice trading setups using important properties of Heikin-Ashi charting method.
End of thread. Sorry if it was too long :-)
End of thread. Sorry if it was too long :-)
Loading suggestions...