

Thread:- How Ichimoku indicator is calculated.
If we collect last 52 bars and combine them to make one candle from it, the high of the combined candle will be highest high of those 52-bars and Low of the combined candle will be lowest low of the last 52-bars.
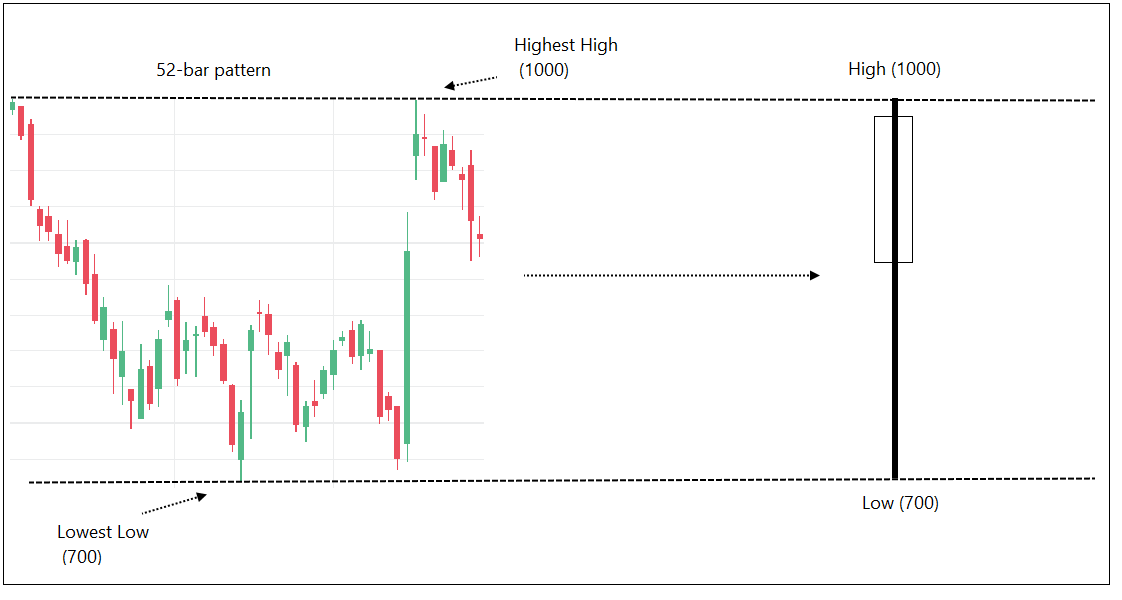
We now have a 52-bar candle. Eg – highest high of the pattern is 1000 and lowest los is 700. Its average price would be 850, that is (high price + low price) divided by 2.
This 52-bar average price plotted after 26-bars typically acts as an important support or resistance line
This 52-bar average price plotted after 26-bars typically acts as an important support or resistance line
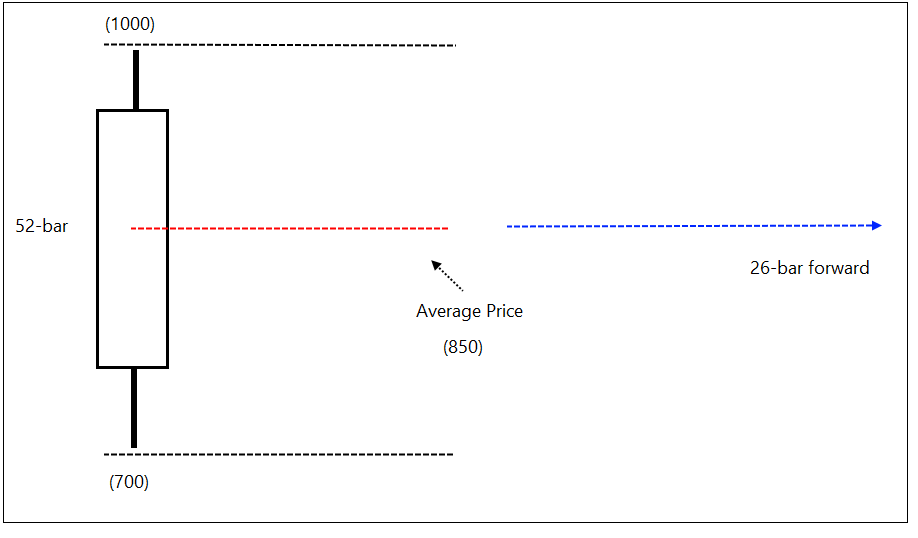
In other words, for today, the 52-bar average range of the price bar printed 26-bars earlier, is an important support resistance line. This line is known as SPAN B.
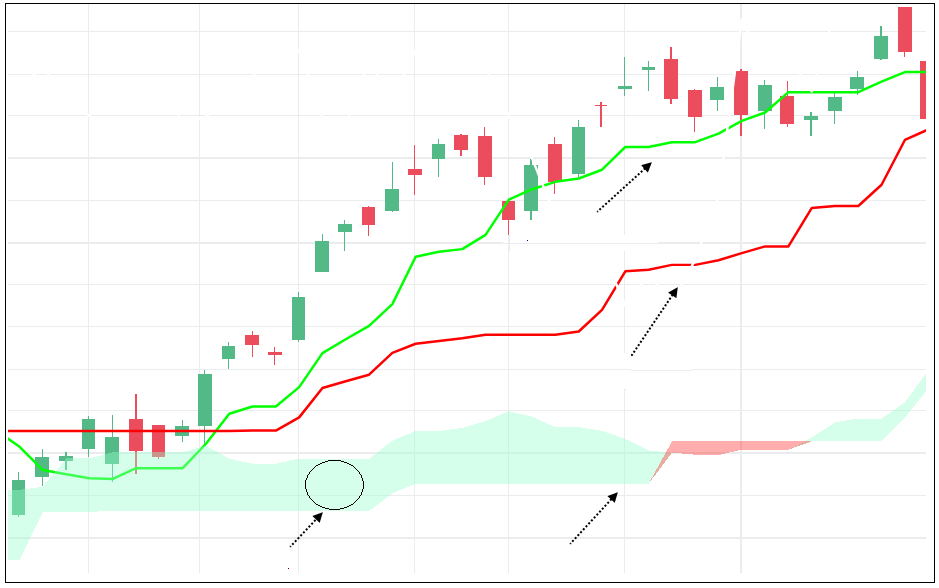
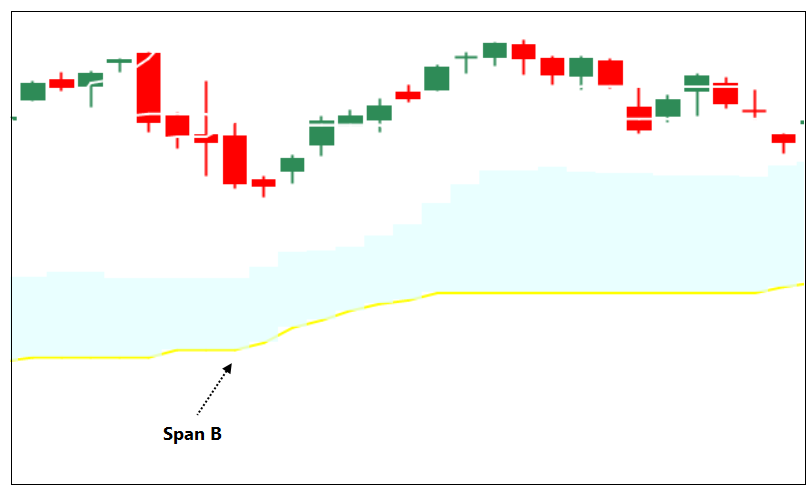
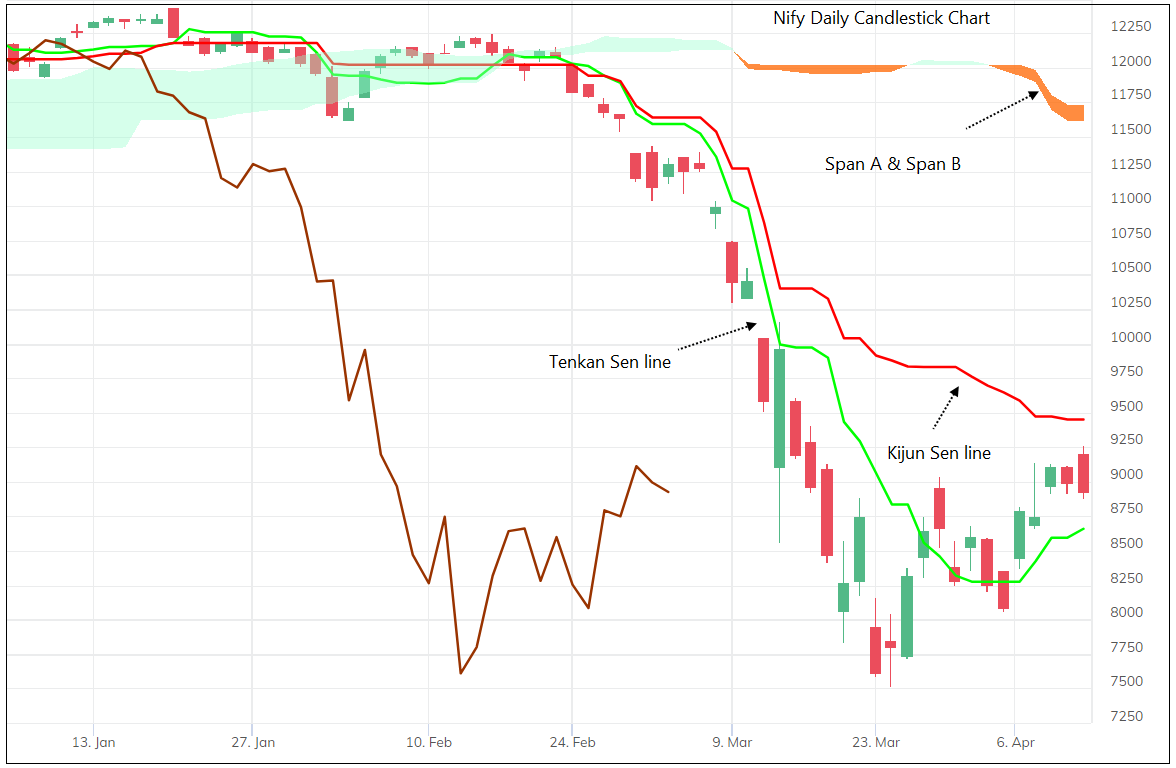
The yellow line in the chart is called as Span B which is calculated as explained above. It is a long-term reference line.
The blue cloud in the chart is known as Ichomoku cloud that consists of two lines: Span B and Span A.
We have discussed Span B, let us see what span A is
The blue cloud in the chart is known as Ichomoku cloud that consists of two lines: Span B and Span A.
We have discussed Span B, let us see what span A is
But, before getting into Span A calculation, we need to understand a couple of other components which are used to calculate Span A. The two components we need to study before Span A calculations are Tenkan Sen & Kijun Sen.
Tenkan Sen:
We earlier combined 52 bars to calculate span B. Similarly, we can make a combined candle by merging last 9-bars. Have a look below.
We earlier combined 52 bars to calculate span B. Similarly, we can make a combined candle by merging last 9-bars. Have a look below.
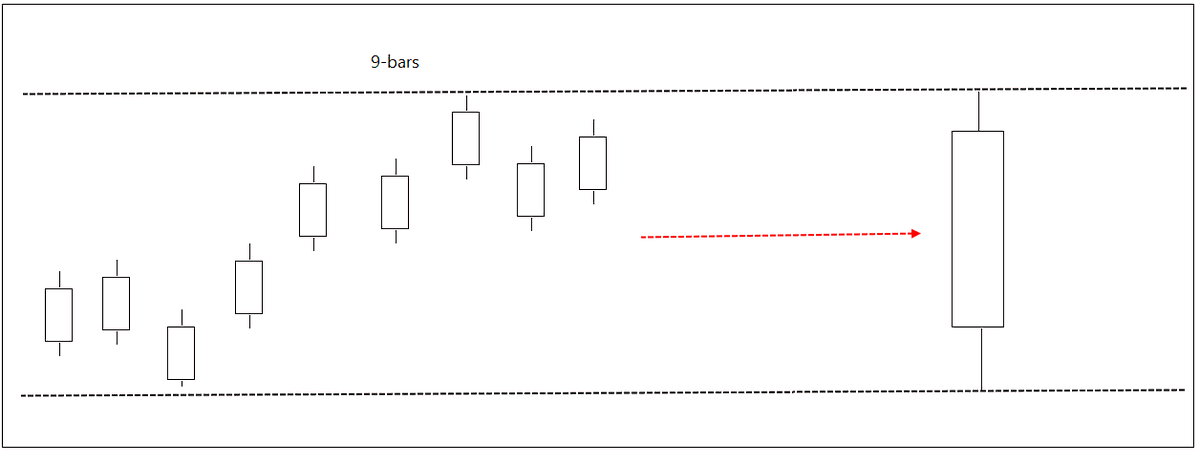
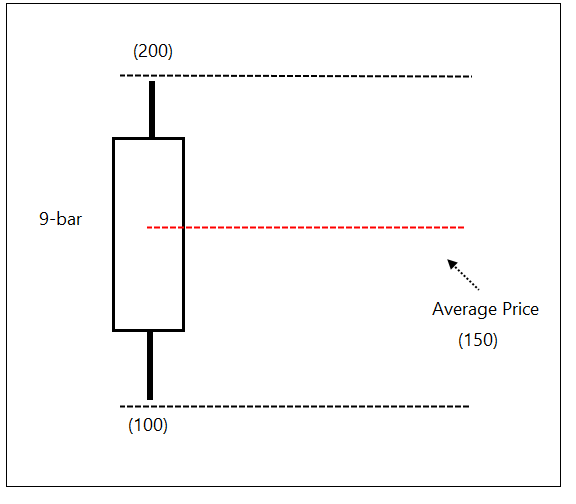
For example, if the highest high of last 9 bars is 200 and lowest low is 100. Average price would be 150.
We can plot this 9-bar average line on chart itself. It can work as short-term support-resistance line. Known as Tenkan Sen line in Ichimoku.
We can plot this 9-bar average line on chart itself. It can work as short-term support-resistance line. Known as Tenkan Sen line in Ichimoku.
Similarly, if we make a combined candle of the last 26-bars and calculate its average price. It becomes medium term reference line on the chart, known as Kijun Sen line.
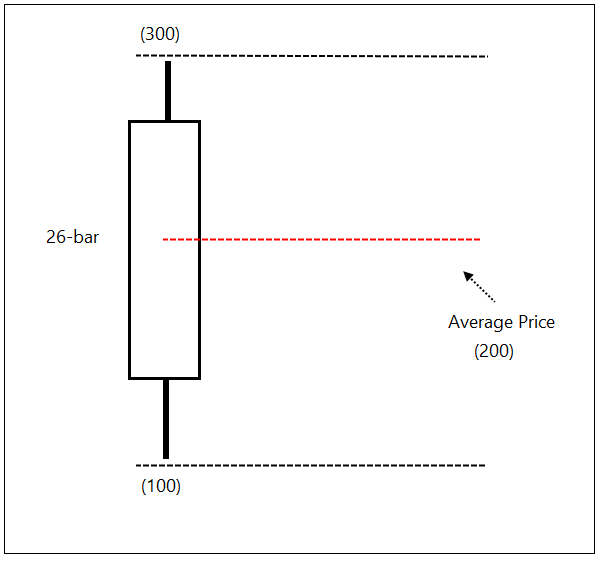
So, now we have three lines on the chart.
Span B (Past 52-bar average price) , Tenkan Sen (9-bar average price), Kijun Sen (26-bar average price).
Span B (Past 52-bar average price) , Tenkan Sen (9-bar average price), Kijun Sen (26-bar average price).
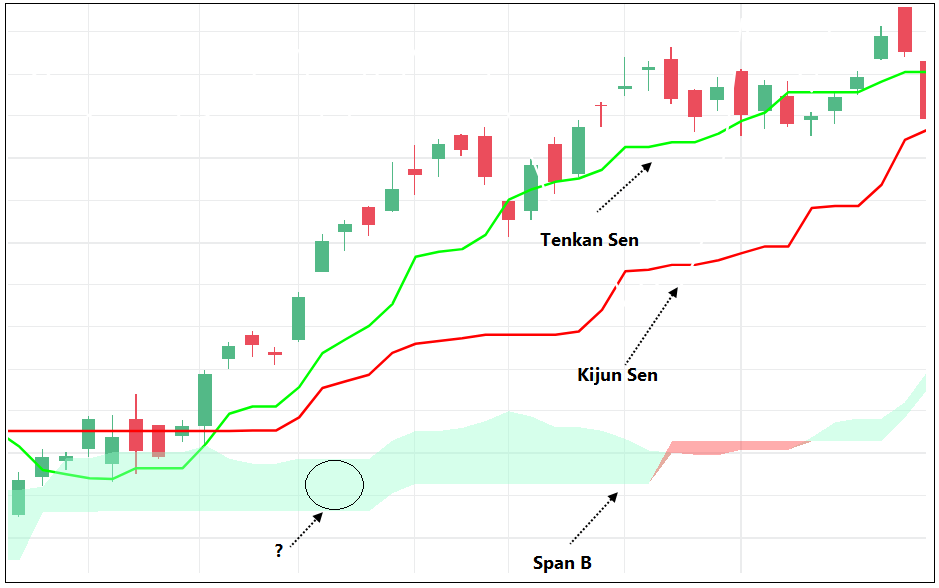
Ichimoku theory states that the trend in the chart is bullish when Tenkan Sen line is above Kijun Sen line. Basically, the trend is bullish when the short-term average line is above medium-term average line. It is bearish when Tenkan Sen line is below Kijun sen line.
Let’s now look at Span B calculation.
Let’s make a box of Tenkan Sen and Kijun Sen lines. It has a high price and low price.
Let’s make a box of Tenkan Sen and Kijun Sen lines. It has a high price and low price.
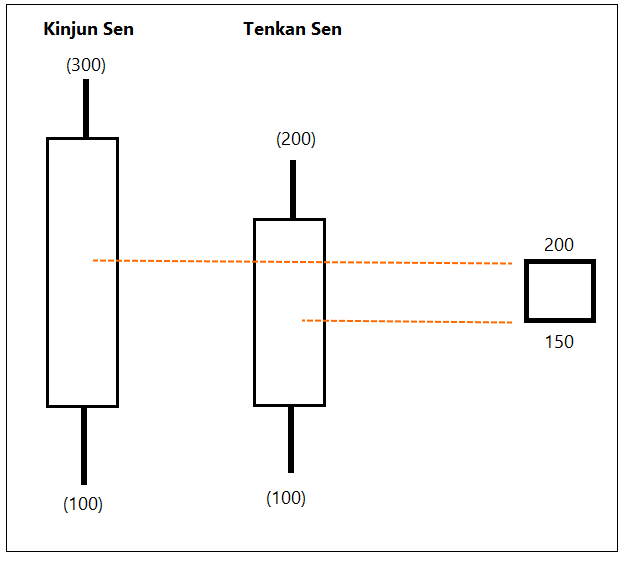
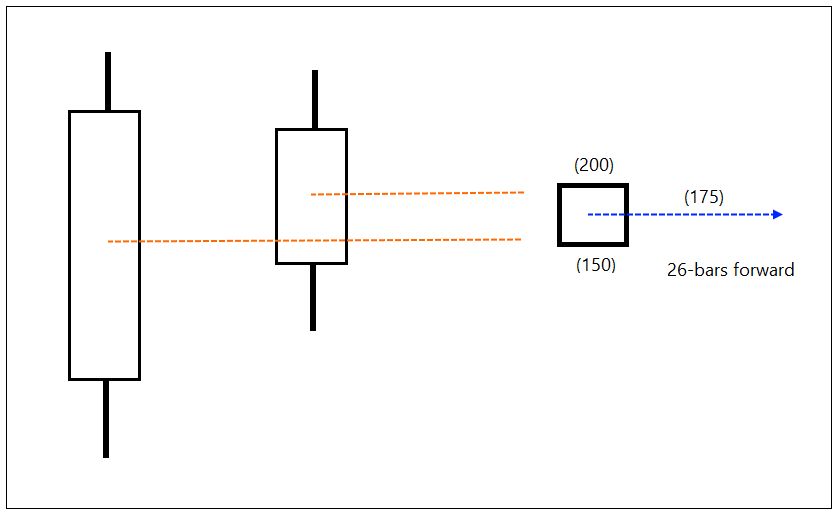
Let us calculate the average price of Tenkan Sen & Kijun Sen lines and plot it 26-bar forward. This line is known as span A.
Span A & Span B together constitute the ichimoku cloud.
Span A & Span B together constitute the ichimoku cloud.
Let us recap the entire process.
Today’s span A line is average price of Tenkan sen (TL) & Kijun sen (KL) box of 26-days before.
Span A and span B lines together constitute the cloud.
If Span A > Span B then cloud is bullish
If Span A < Span B then cloud is bearish
Today’s span A line is average price of Tenkan sen (TL) & Kijun sen (KL) box of 26-days before.
Span A and span B lines together constitute the cloud.
If Span A > Span B then cloud is bullish
If Span A < Span B then cloud is bearish
Spend time on understanding how they are calculated.
TL = 9-bar average price
KL = 26-bar average price
Span A = Average of TL & KL 26-days before
Span B = 52-bar average price of 26-days before
TL = 9-bar average price
KL = 26-bar average price
Span A = Average of TL & KL 26-days before
Span B = 52-bar average price of 26-days before
Basic rules:
TL > KL = Bullish
If it is above clouds and if clouds are bullish – it is a strong bullish signal.
TL < KL = Bearish
If it is below clouds and if clouds are bearish – it is a strong bullish signal.
When price is between clouds – avoid taking trading signals.
TL > KL = Bullish
If it is above clouds and if clouds are bullish – it is a strong bullish signal.
TL < KL = Bearish
If it is below clouds and if clouds are bearish – it is a strong bullish signal.
When price is between clouds – avoid taking trading signals.
Think, what it means when we price is stuck between the cloud?
9-26-62 are default periods. You can change that and experiment with different parameters.
There can be more rules and there are many traders following this method.
9-26-62 are default periods. You can change that and experiment with different parameters.
There can be more rules and there are many traders following this method.
Spend time on how it is constructed, and you will better understand the indicator. Buy when green is above red - will not work in long-term. Think - why green above red, what are those lines. You will gain better understanding of technical analysis.
There are English names to the Japanese indicator names:
Tenkan Sen = Conversion Line
Kinjun Sen = Base Line
Senkou Span A = Leading Span A
Senkou Span B = Leading Span B
Tenkan Sen = Conversion Line
Kinjun Sen = Base Line
Senkou Span A = Leading Span A
Senkou Span B = Leading Span B
Ichimoku indicator can also be plotted on Noiseless charts - formula remain same but logic is different.
There is one more line – Chikou span (Lagging Span) in Ichimoku indicator. I will explain that next time.
End of thread.
There is one more line – Chikou span (Lagging Span) in Ichimoku indicator. I will explain that next time.
End of thread.
Loading suggestions...