

Thread on Relative Strength Index or RSI.
Devised by J. Welles Wilder, RSI (Relative Strength Index) is one the most popular indicators in Technical analysis. Let us try to understand the underlying formula and logic behind this indicator.
Devised by J. Welles Wilder, RSI (Relative Strength Index) is one the most popular indicators in Technical analysis. Let us try to understand the underlying formula and logic behind this indicator.

RSI indicator is calculated on closing price.
We can define bullish and bearish price on a closing basis (Line chart) chart as follows:
If current price is higher than previous price = Bullish bar
If Current price is lower than previous price = Bearish bar
We can define bullish and bearish price on a closing basis (Line chart) chart as follows:
If current price is higher than previous price = Bullish bar
If Current price is lower than previous price = Bearish bar

Now that we have defined what is bullish and bearish, it is important to find out how much bullish and bearish.
Price went up by 10 points and fell by 15 points is more of a bearish.
Price went up by 10 points and fell by 15 points is more of a bearish.

So, now we know price trend and the amount of gain or loss.
Below is a chart connecting 10 closing prices. Let us calculate gains and losses on this chart.
Below is a chart connecting 10 closing prices. Let us calculate gains and losses on this chart.

In the above chart,
Bullish readings (Gain) are = 10, 25, 7, 20 & 8
Bearish reading (Loss) are = 8, 7, 5, 30 & 20
Let us calculate the simple average price of the gains & losses:
Bullish average = 14 ((10+25+7+20+8)/5)
Bearish average =14 ((8+7+5+30+20)/5)
Bullish readings (Gain) are = 10, 25, 7, 20 & 8
Bearish reading (Loss) are = 8, 7, 5, 30 & 20
Let us calculate the simple average price of the gains & losses:
Bullish average = 14 ((10+25+7+20+8)/5)
Bearish average =14 ((8+7+5+30+20)/5)
What does the above information mean?
It just means, over the last 10 days, average gains were 14 points and average losses 14 points.
These are absolute points. How to know how strong the bulls are?
It just means, over the last 10 days, average gains were 14 points and average losses 14 points.
These are absolute points. How to know how strong the bulls are?
Imagine there are 10 people from Green and Red teams are sitting in a hall.
There are 7 people from Green team and 3 from Red.
What is the strength of Green team? 70% - right?
That is what RSI represents.
There are 7 people from Green team and 3 from Red.
What is the strength of Green team? 70% - right?
That is what RSI represents.

In the earlier chart example – the average of losing bars plus the average of winning bars was 14+14 = 28.
Average gain was 14. So, RSI will be ((14/28) x 100) = 50%
So, when RSI is at 50, it means Average gain is equal to Average loss.
Average gain was 14. So, RSI will be ((14/28) x 100) = 50%
So, when RSI is at 50, it means Average gain is equal to Average loss.
If total points are 30 and average gain is 18, the RSI would be at 60.
If total points are 30 and average gain is 9 – RSI would be at 30.
Got it?
If total points are 30 and average gain is 9 – RSI would be at 30.
Got it?
14-day is a recommended parameter by Wilder and you will find it as a default parameter in most of the software. Like ADX, Wilder used his averaging method to calculate average in RSI indicator.
Because of the averaging method, 75 – 25 can be considered as a normal range.
Because of the averaging method, 75 – 25 can be considered as a normal range.
It needs very strong trend without significant correction for indicator to move below 10 or above 90.
Wilder’s method of averaging is slow compared to other methods of averaging such as SMA, EMA, WMA etc.
Wilder’s method of averaging is slow compared to other methods of averaging such as SMA, EMA, WMA etc.
Remember, when you plot a14-period RSI – it shows the strength of average gains over last 14 bars.
So, there is a virtual box of last 14 bars on price. If there is a strong bullish or bearish close during the 14 days – it can dominate the RSI reading.
So, there is a virtual box of last 14 bars on price. If there is a strong bullish or bearish close during the 14 days – it can dominate the RSI reading.
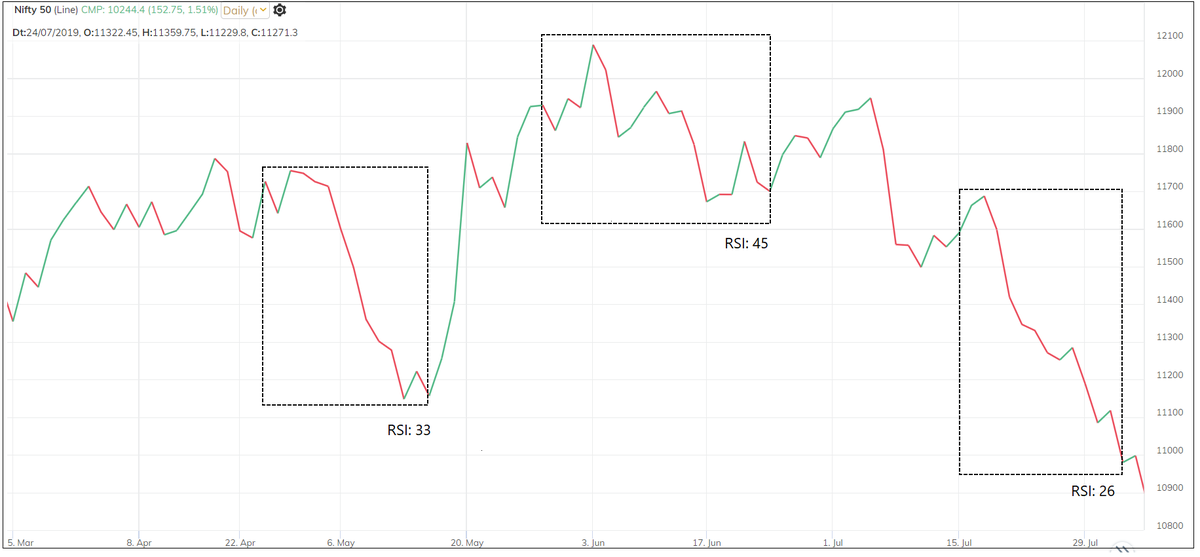
Observe the pattern in the boxes drawn on the below chart.

Below is a chart showing RSI at last bar on those boxes.
Do this exercise, remove RSI from the chart. Focus on the price action of last 14 bars – try to guess the RSI number.
See two boxes in below chart.
See two boxes in below chart.
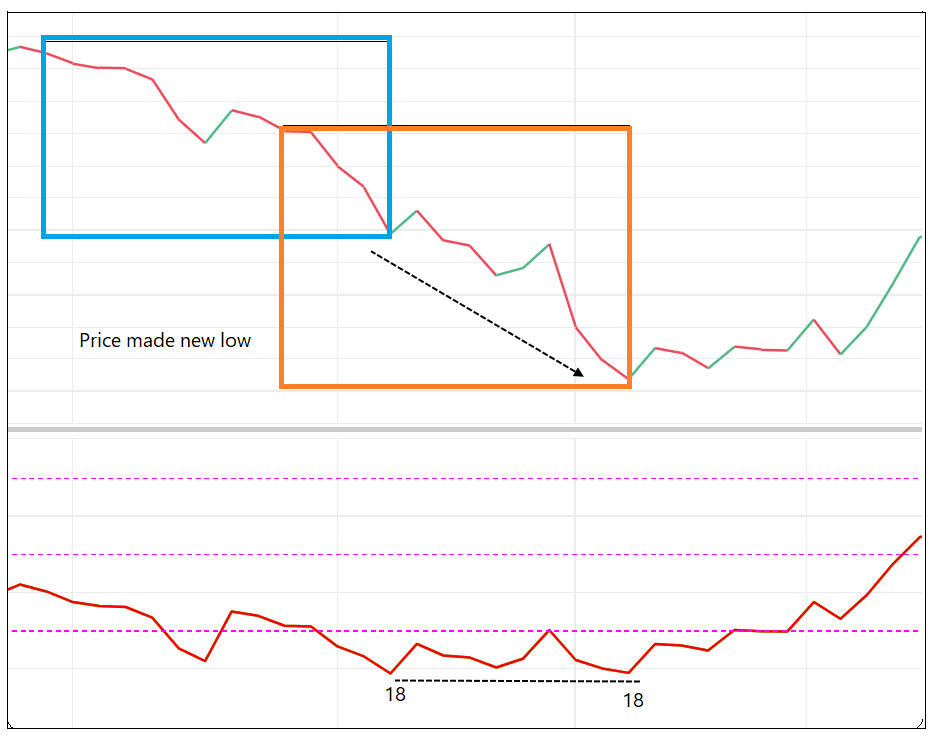
RSI is 18 at end of Blue box. Price makes new low in Orange box but RSI remains at 18. Why?
There were some gains recorded on a few sessions in that Orange box that did not let the RSI fall rapidly.
There were some gains recorded on a few sessions in that Orange box that did not let the RSI fall rapidly.
When price makes new low, but RSI doesn’t, it is known as a bullish divergence. It means there were gains in between while price made new lows but the gains prevented the RSI from making a corresponding lower low. The logic is reversed for the Bearish divergence.
Clear?
Clear?
If RSI is at 70, average gains are 70% of total gains and losses. If RSI is at 20, average gains are 20% of total gains and losses over selected period.
Average of RSI is known as signal line. It helps in smoothing the RSI data. Default parameter is 9 period.
Average of RSI is known as signal line. It helps in smoothing the RSI data. Default parameter is 9 period.
70-30 overbought – oversold levels? RSI above 50 on multiple timeframes? Trading crossovers or trend lines on RSI etc. Social media and online content is flooded with ideas & trading strategies using this indicator. But understand what the indicator captures.
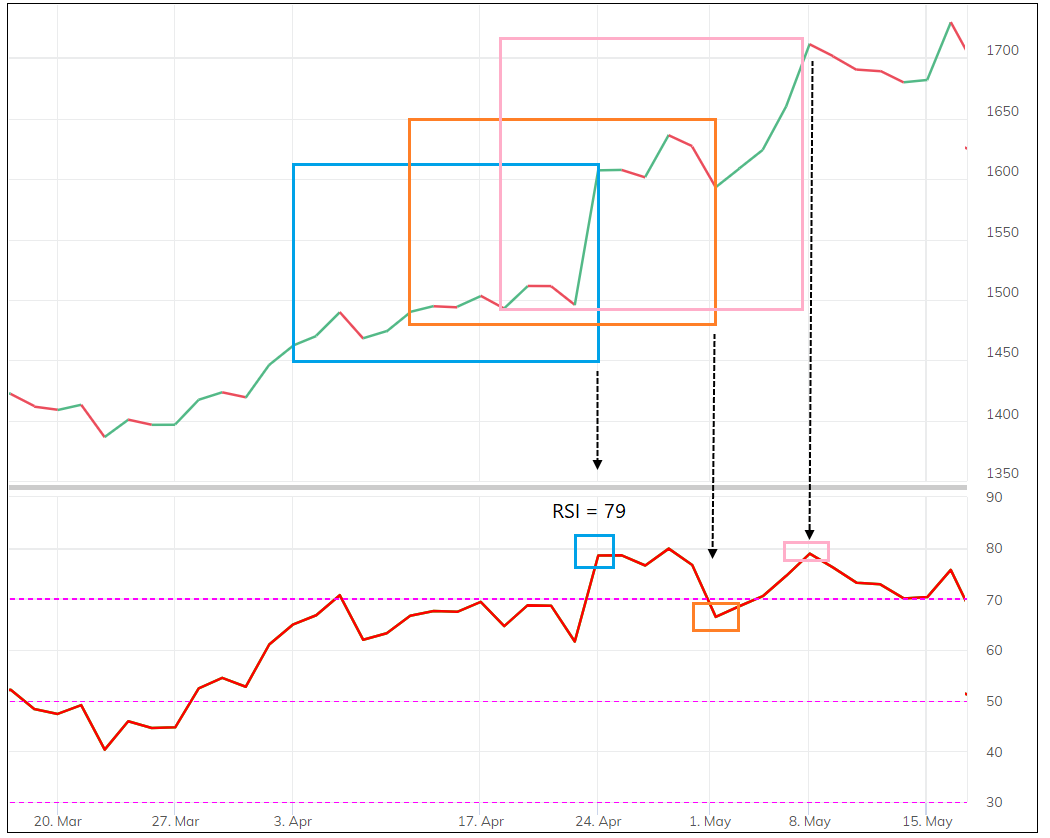
Observe the number of bullish and bearish lines in below boxes. Price continued to move up but RSI remained around same zone.
Why?
Hope you have deciphered the answer by now !!
Why?
Hope you have deciphered the answer by now !!
There is more to talk about method of averaging. There is one indicator which is on similar lines and very interesting. I will write about that in the next thread.
<End of Thread>
<End of Thread>
Loading suggestions...