

Thread: CCI Indicator
Invented by Donald Lambert, CCI stands for Commodity Channel Index.
There are three parts of CCI Indicator: You can remember it as TMC.
#CCI #Indicators #Definedge
Invented by Donald Lambert, CCI stands for Commodity Channel Index.
There are three parts of CCI Indicator: You can remember it as TMC.
#CCI #Indicators #Definedge

While analysing the trend of the price, we can consider closing price, high price or low price. What if we calculate the average of High, Low and Closing price - It is known as a Typical price.
Typical price = (High + Low + Close) / 3
Typical price = (High + Low + Close) / 3
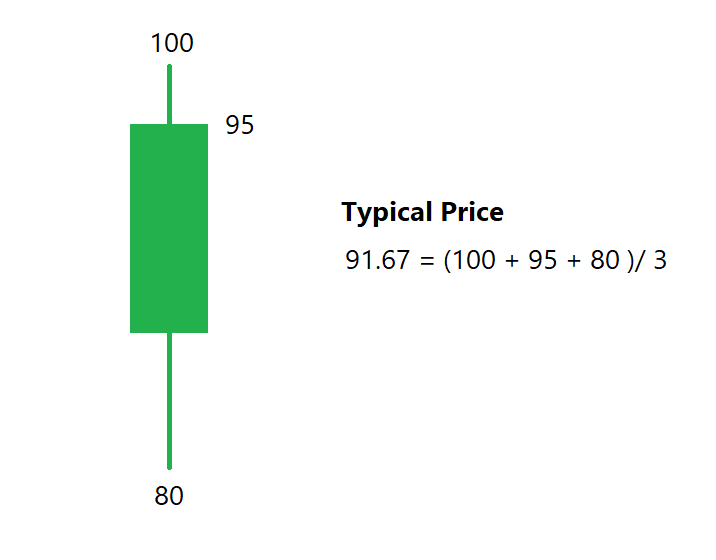
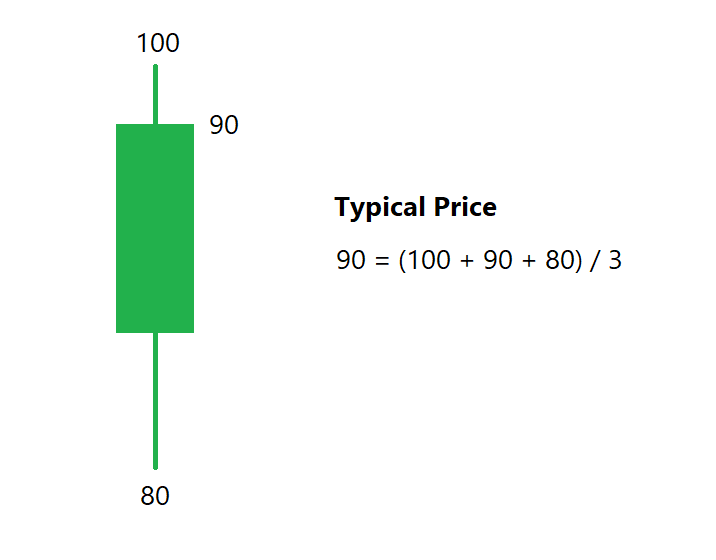
If closing price is exactly at mid-range of candle, Typical price would be equal to closing price.
Understood Typical price? T in TMC stands for Typical Price.
Understood Typical price? T in TMC stands for Typical Price.
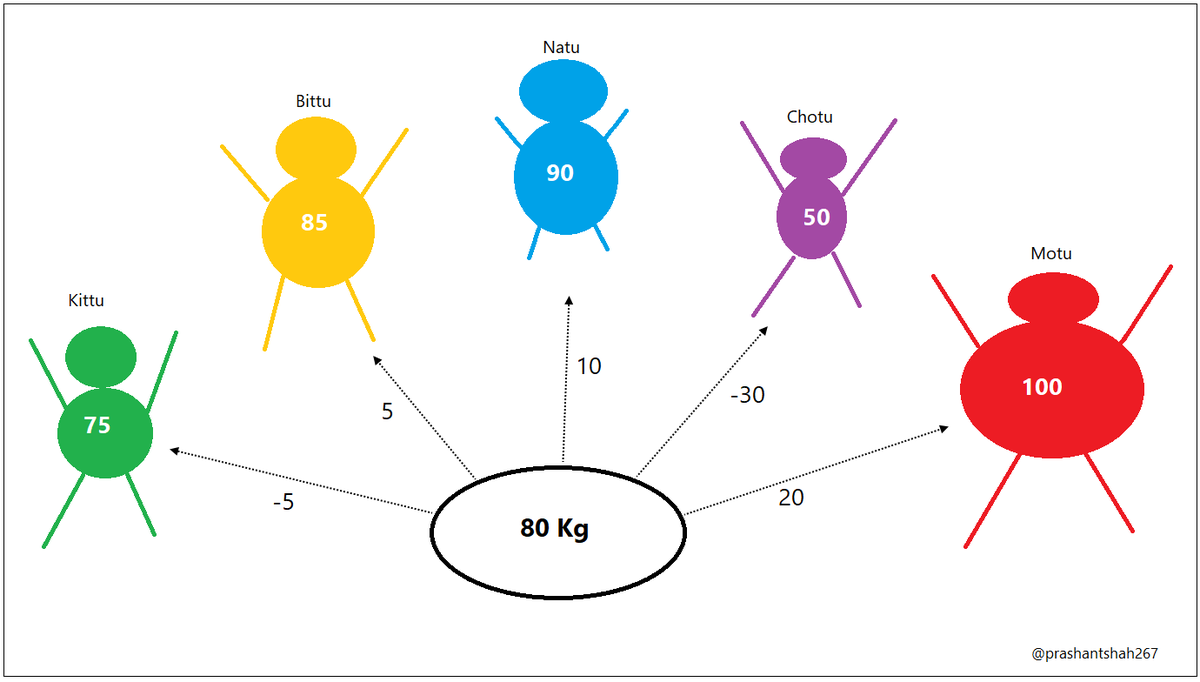
If there are 5 members in a family. We can calculate the average weight of the family.
See below image for example, average weight of family members in this family is 80 kg.
See below image for example, average weight of family members in this family is 80 kg.

If we want to see how far each family member is from the ave weight?
Kittu: -5 (75 – 80)
Bittu: 5 (85 -80)
Natu: 10 (90- 80)
Chotu: -30 (50 – 80)
Motu: 20 (100 – 80)
Kittu is relatively weak because his weight is far away from the average while Motu is relatively strong. Right?
Kittu: -5 (75 – 80)
Bittu: 5 (85 -80)
Natu: 10 (90- 80)
Chotu: -30 (50 – 80)
Motu: 20 (100 – 80)
Kittu is relatively weak because his weight is far away from the average while Motu is relatively strong. Right?
So by observing the difference between price and average, we can come to know which number is strong (Positive and far from the average) and weak (Negative and far from the average).
Let’s calculate the average of all the differences, positive or negative.
Let’s calculate the average of all the differences, positive or negative.
Average difference in above case is 14 kg.
(5 + 5 + 10 + 30 + 20) /5 = 14
So, average distance from 80 kg is 14 kg in above example. This concept is known as Mean Deviation. It tells us average difference between data points and average.
Can we apply this concept on charts?
(5 + 5 + 10 + 30 + 20) /5 = 14
So, average distance from 80 kg is 14 kg in above example. This concept is known as Mean Deviation. It tells us average difference between data points and average.
Can we apply this concept on charts?
We can calculate average of last 20 prices by applying moving average on last 20 prices. If we know the average price, we can also calculate Mean Deviation. Mean deviation would tell us average distance of last 20 prices from the moving average price.
Understood the concept of Mean Deviation? M stands for Mean deviation in TMC. For CCI, it is calculated on Typical Price. 0
Now pay attention to this:
For example, Average of last 20-day price of Nifty is 10200. Mean deviation is 100 points.
Now pay attention to this:
For example, Average of last 20-day price of Nifty is 10200. Mean deviation is 100 points.
Meaning, on an average price has remained within 100 points from the moving average over last 20 bars.
What if current price is 10400?
Difference would be 200 points (10400 – 10200). It is double than the average difference.
Isn’t it bullish?
What if current price is 10400?
Difference would be 200 points (10400 – 10200). It is double than the average difference.
Isn’t it bullish?
So, if we compare recent data with average difference, we can get to know how strong or weak recent data is. So, we can divide the difference between current price and average by mean deviation to arrive at this. This is what CCI does.
But while dividing the difference by MD, MD is multiplied by a constant number 0.015 in CCI. C stands for Constant in TMC.
So, CCI = (Current Typical price – Average of Typical prices) / (Mean Deviation * 0.015)
So, CCI = (Current Typical price – Average of Typical prices) / (Mean Deviation * 0.015)
If CCI is above zero or below zero, price is above or below moving average – but Remember, here price is a typical price
Multiplying MD by Constant results in following things which you need to understand while using CCI:
Multiplying MD by Constant results in following things which you need to understand while using CCI:
If current difference is exactly at the average difference, CCI reading would be 66.67 or -66.67.
If current difference is 1.5x of average difference, CCI reading would be 100 or -100.
If current difference is 3x of average difference, CCI reading would be 200 or -200.
If current difference is 1.5x of average difference, CCI reading would be 100 or -100.
If current difference is 3x of average difference, CCI reading would be 200 or -200.
So, if I say CCI remains most of the time between +100 and -100 , it means that current price to average difference remains below 1.5x.
Understood?
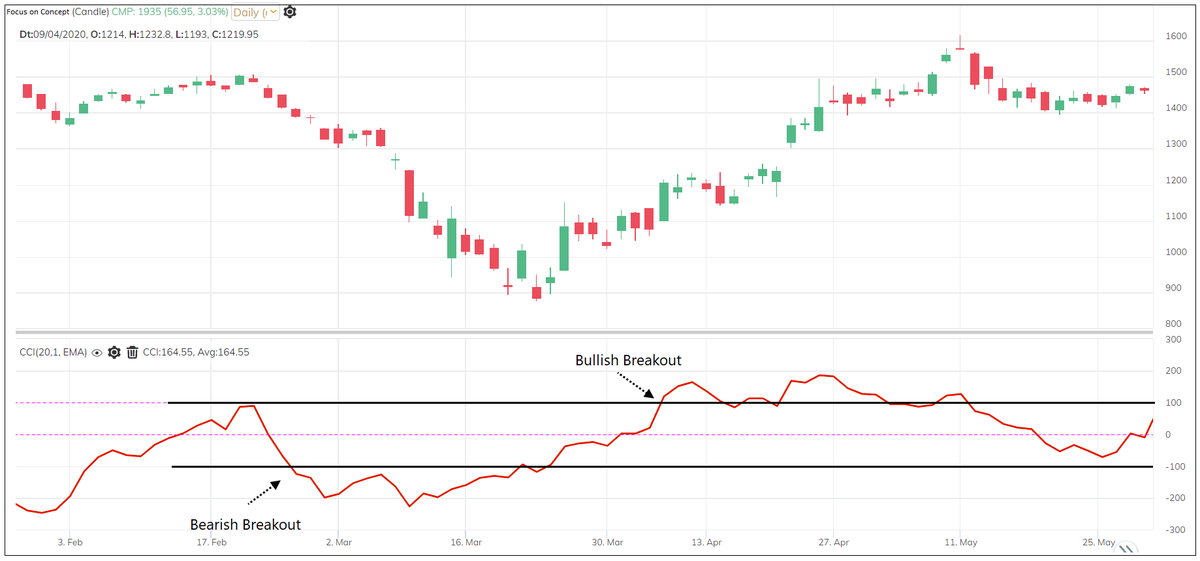
Now, if I say CCI moving above +100 is bullish and moving below -100 is bearish – does it make sense to you?
Understood?
Now, if I say CCI moving above +100 is bullish and moving below -100 is bearish – does it make sense to you?
Is CCI above zero mean price is above ave (bullish) and diff is increasing (Momentum)? Is CCI going above 100 shows strong momentum? Do CCI take High – Low prices into account? If yes, how? Why constant was used? Why Typical price?
Think. You know the concept now to explore.
Think. You know the concept now to explore.
I have more ideas to share on this (future threads).
Buying at Green and Selling at Red can work only if you have a logical understanding which would help in building conviction. Otherwise, journey to find best system or indicator is endless.
<End of Thread>
Buying at Green and Selling at Red can work only if you have a logical understanding which would help in building conviction. Otherwise, journey to find best system or indicator is endless.
<End of Thread>
Loading suggestions...