

Thread on How to use Chart Scroller Feature of Tradepoint to Scan Charts Sector Wise 👇
Note: Use Laptop/PC for best experience
1. Link for Tradepoint Web: #chart" target="_blank" rel="noopener" onclick="event.stopPropagation()">tradepoint.definedge.com
2. You will get a login page like this👇
Note: Use Laptop/PC for best experience
1. Link for Tradepoint Web: #chart" target="_blank" rel="noopener" onclick="event.stopPropagation()">tradepoint.definedge.com
2. You will get a login page like this👇
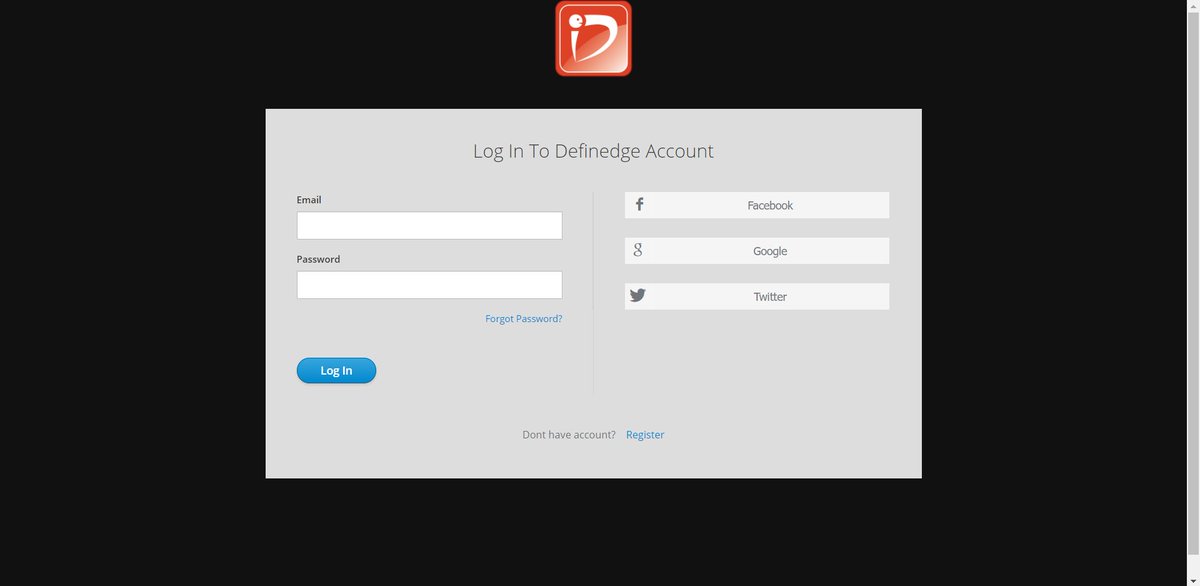
3. Register yourself or you can also directly login using Google/Facebook/Twitter
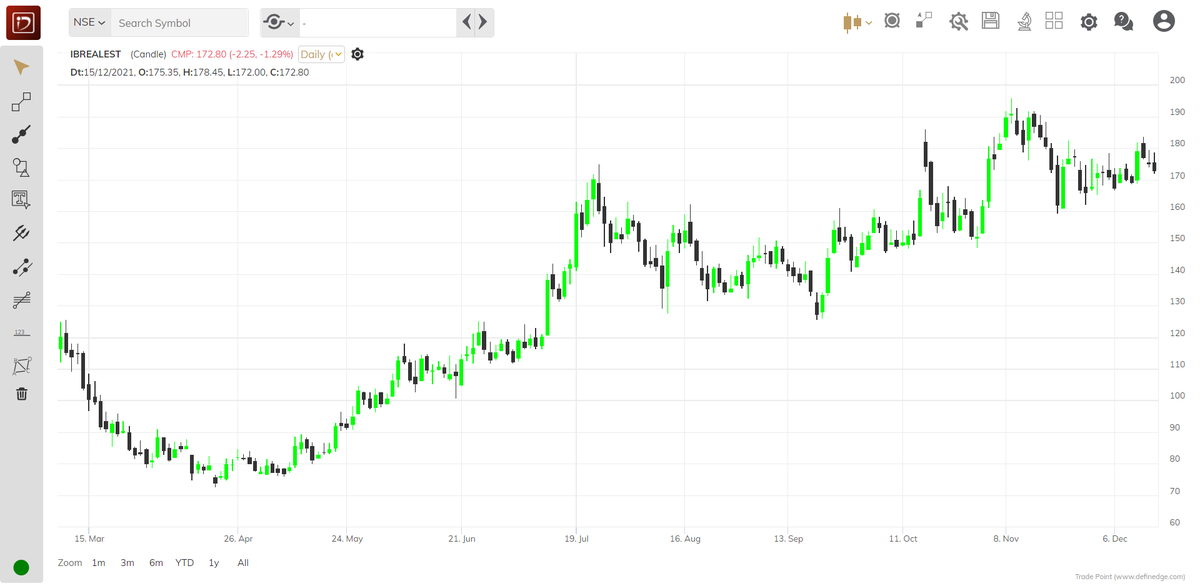
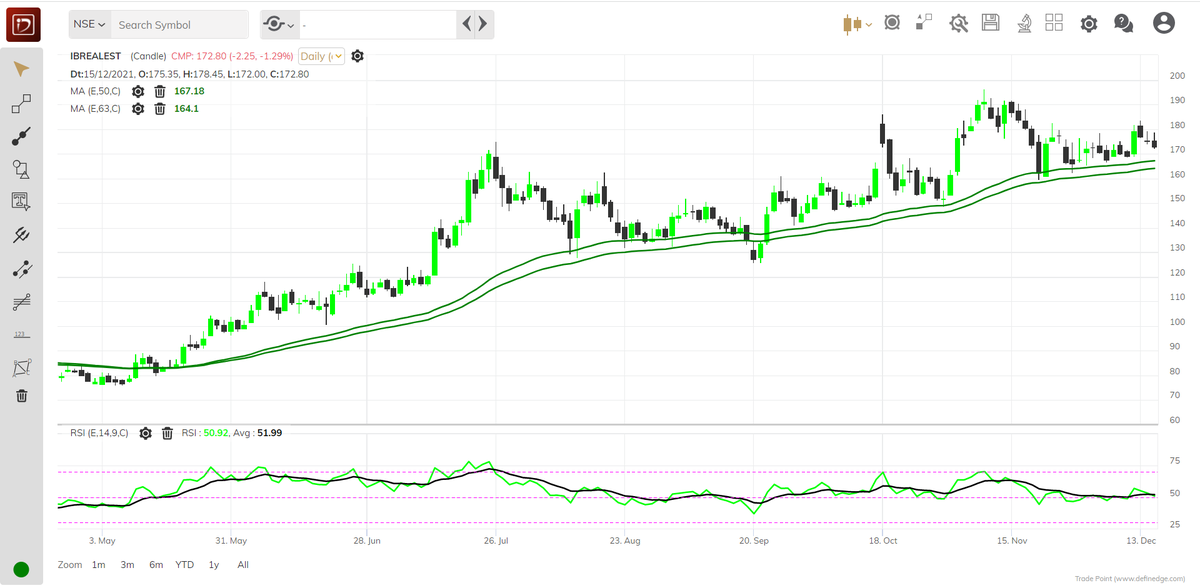
4. You will get an interface like this after logging in👇
4. You will get an interface like this after logging in👇
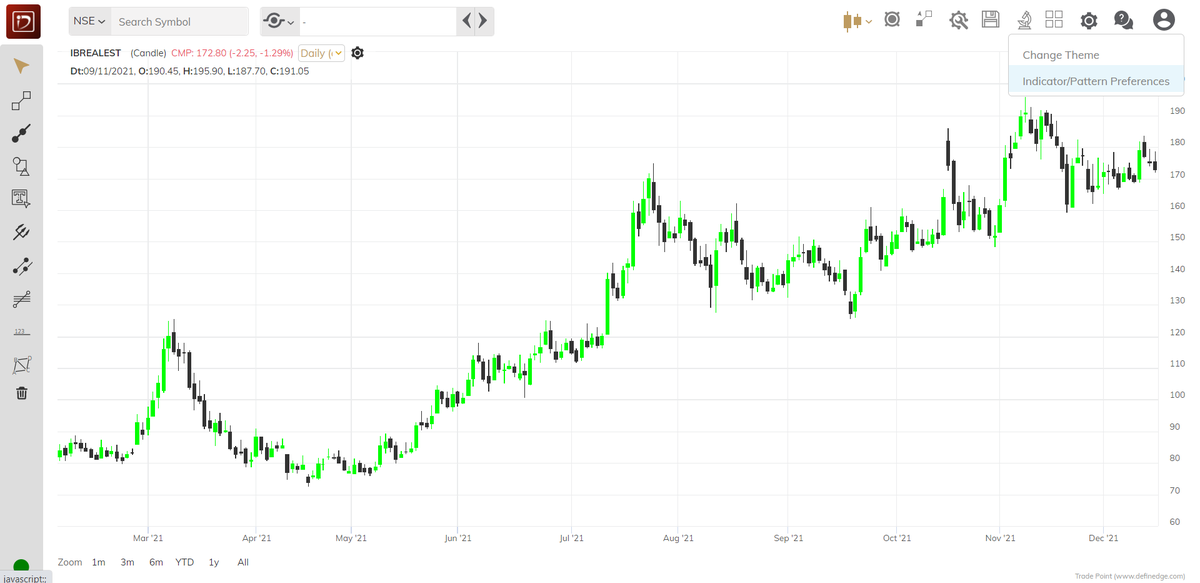
5. Go to settings⚙️ icon at the top right & select Indicator/Pattern Preferences
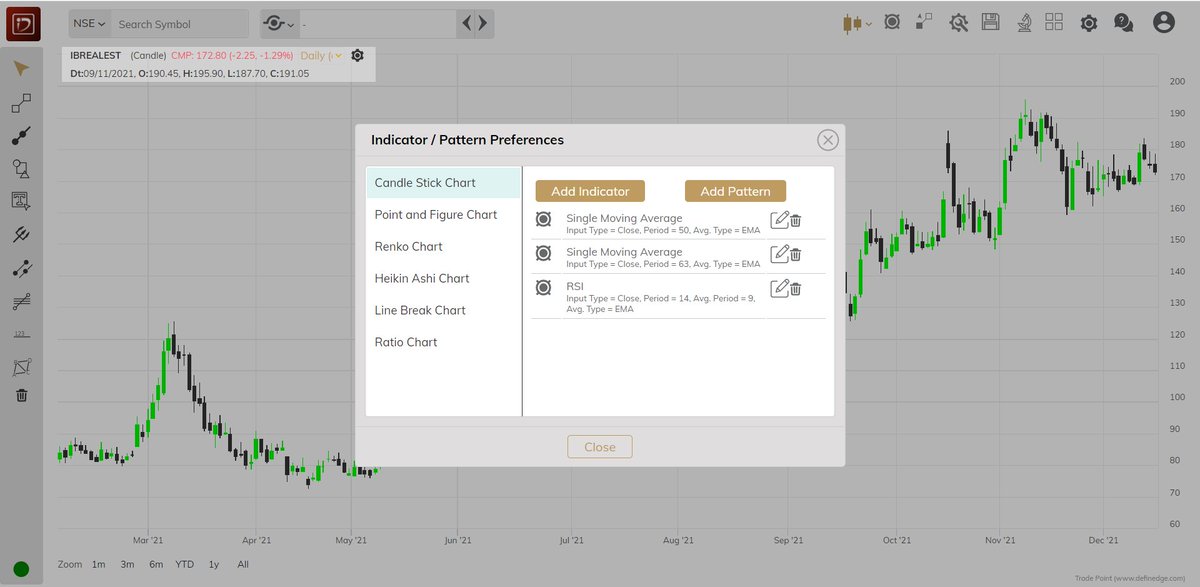
Select your preferences like Moving Averages, RSI, MACD, Bollinger Band etc...
After doing this you have to REFRESH the page for the updated setting to take effect
Select your preferences like Moving Averages, RSI, MACD, Bollinger Band etc...
After doing this you have to REFRESH the page for the updated setting to take effect
6. Now the screen will look like this👇
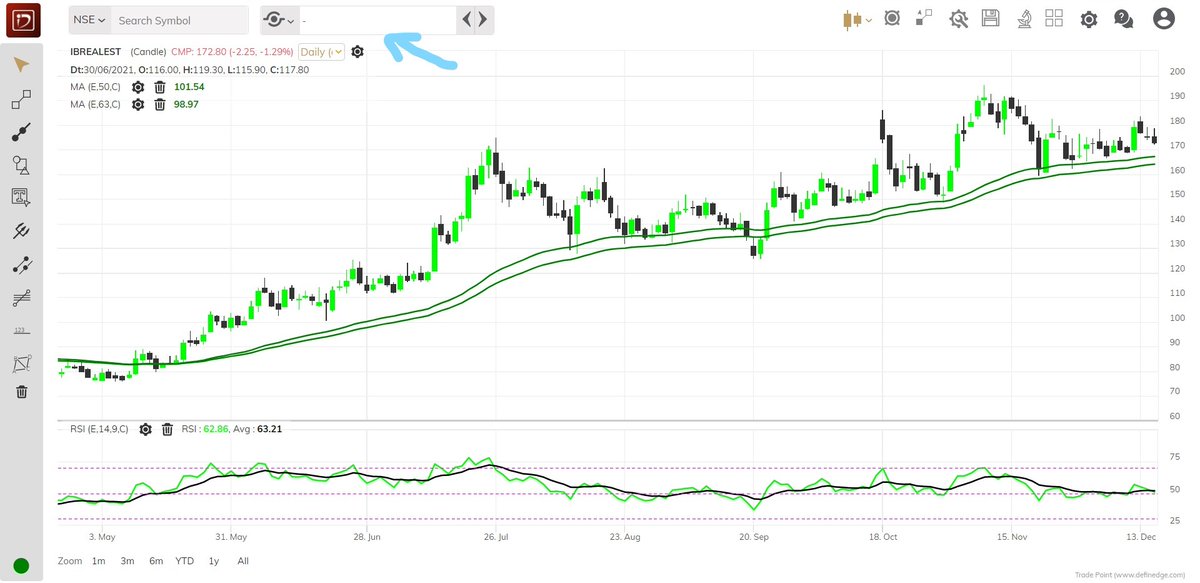
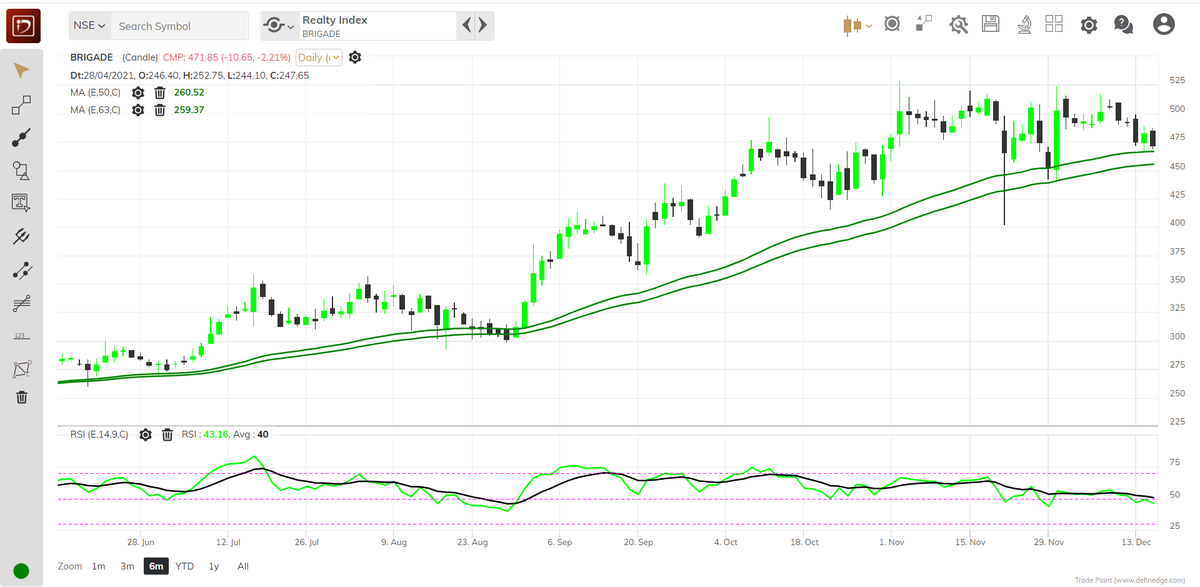
7. At the top of the chart you will find CHART SCROLLER which will be used to select sectors & scan charts
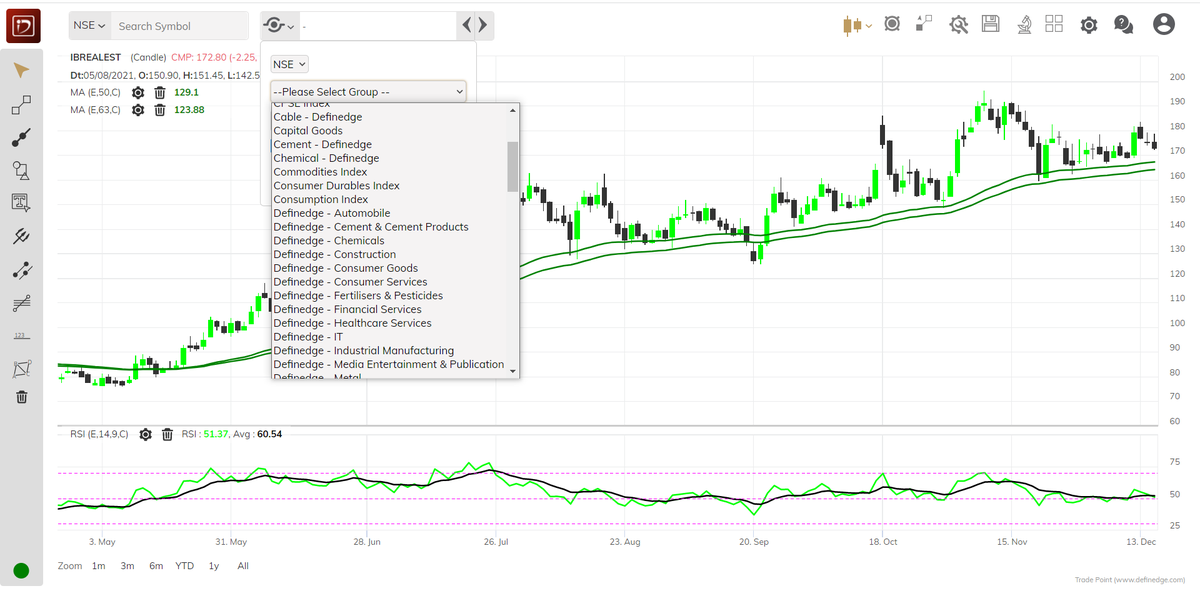
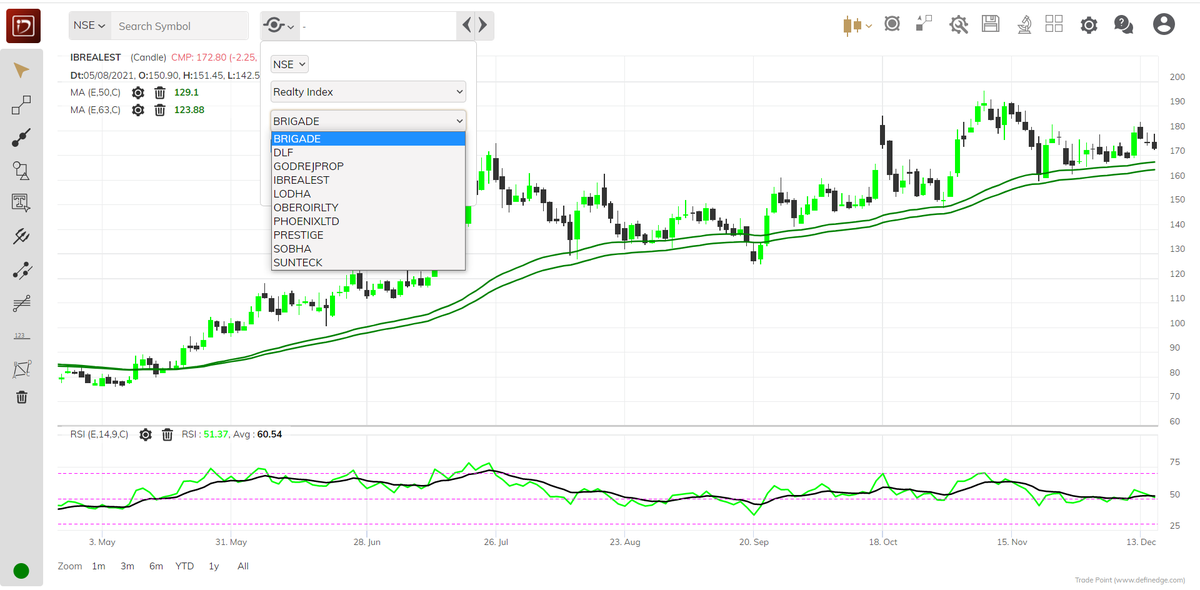
8. For example I select Realty Index then all the stocks will come up in the list
Now you just have to click on next scrip & the charts will automatically come up with your pre defined indicator preferences
Now you just have to click on next scrip & the charts will automatically come up with your pre defined indicator preferences
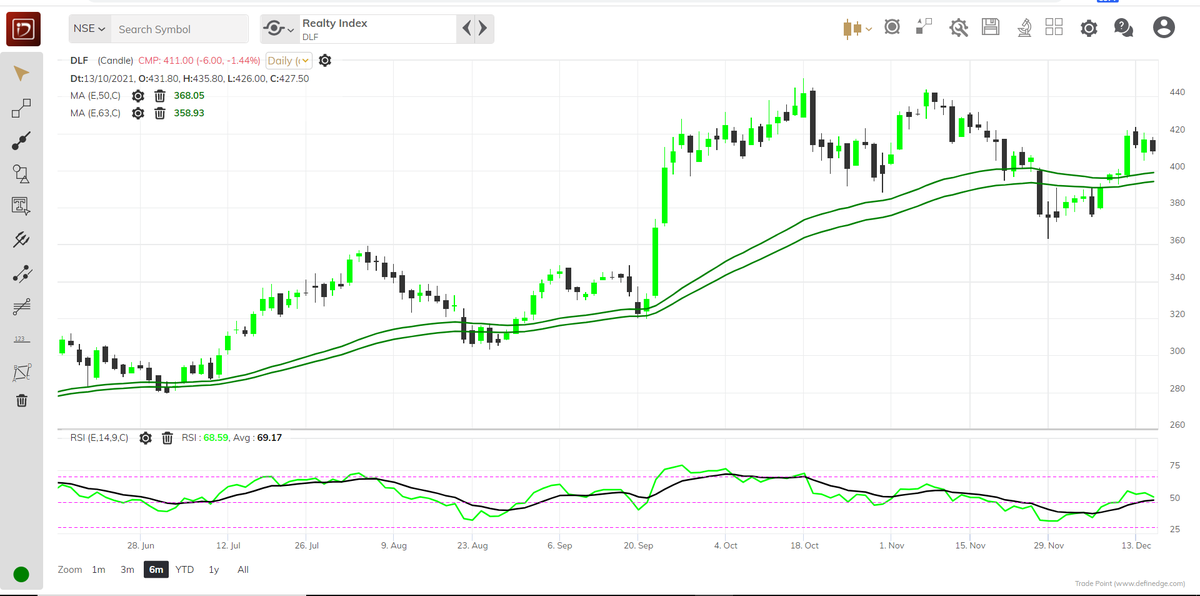
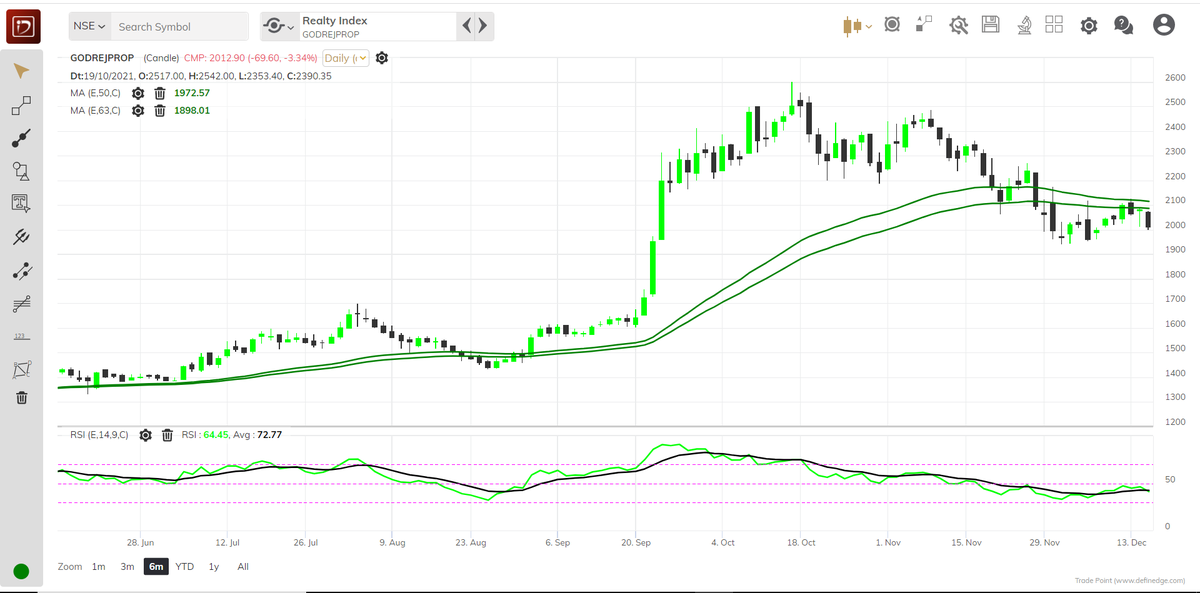
9. It will help you to save your time & improve your chart reading ability also as you will be able to scan many charts in one go rather than manually doing it..
10. Retweet the first tweet for better reach
If you come across any difficulty/doubt feel free to comment..
10. Retweet the first tweet for better reach
If you come across any difficulty/doubt feel free to comment..
Thanks to @Definedge Team , @Prashantshah267 for developing such wonderful product🙏
Loading suggestions...