

Some continuation and reversal patterns explained with chart examples.
Chart names are not important. Applicable on all instruments and timeframes. (1/7)
Chart names are not important. Applicable on all instruments and timeframes. (1/7)
1) Image explaining Double-broadening Pattern. Follow-through in such cases offers nice RR trade opportunity
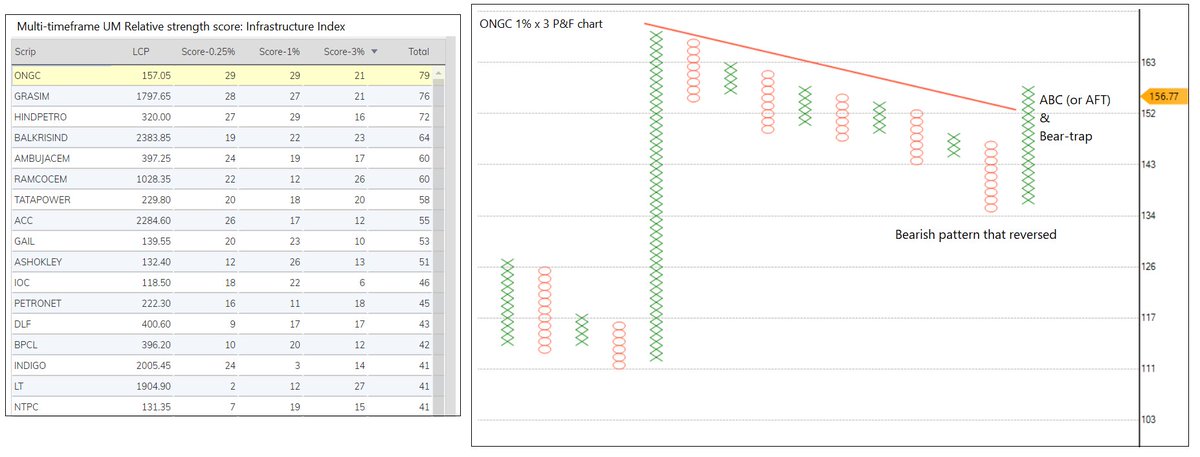
2) Pattern after downtrend on 0.25% box-value. Weakness of bears.
3) Lower shadows on weekly candlestick chart (Demand area)
4) Outperformer of Auto & Infra index
2) Pattern after downtrend on 0.25% box-value. Weakness of bears.
3) Lower shadows on weekly candlestick chart (Demand area)
4) Outperformer of Auto & Infra index


Above is example of Reversal pattern. Another example:
1) Medium-term uptrend. Max 'X' pattern after 4-month downtrend. Bulls strike back.
1) Bullish pattern retest and Anchor column follow-through.
2) Lower shadows on Monthly chart
3) Outperformer of Healthcare index
1) Medium-term uptrend. Max 'X' pattern after 4-month downtrend. Bulls strike back.
1) Bullish pattern retest and Anchor column follow-through.
2) Lower shadows on Monthly chart
3) Outperformer of Healthcare index


Example of a continuation pattern:
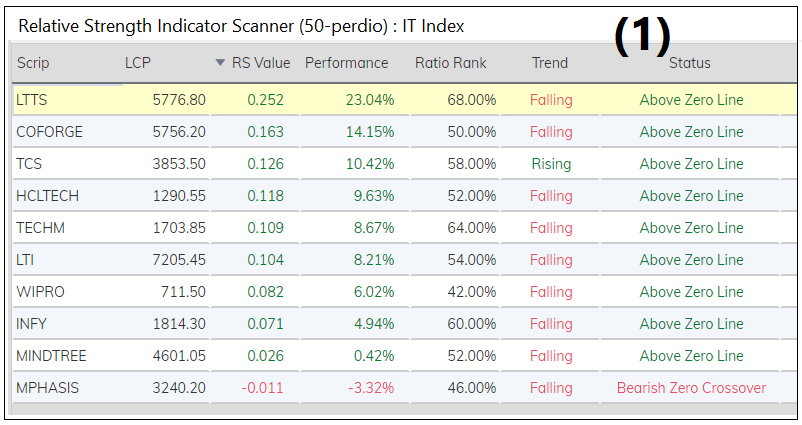
1) Highest reading in RS indicator of IT Index. High returns & ratio rank – Outperformer
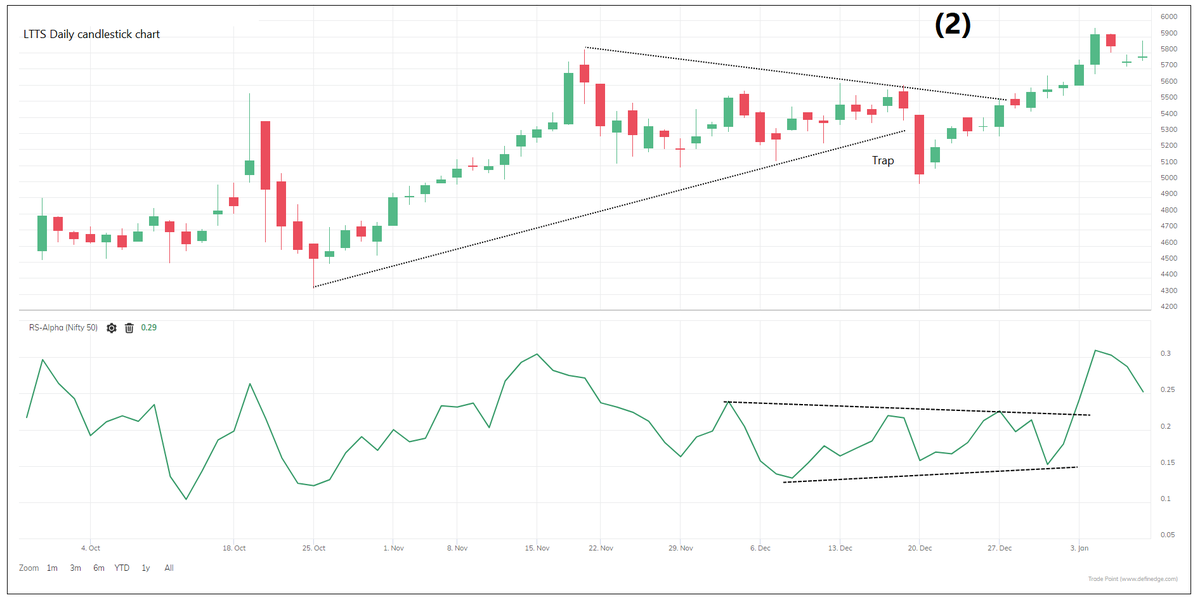
2) False trend line break & bullish RS pattern
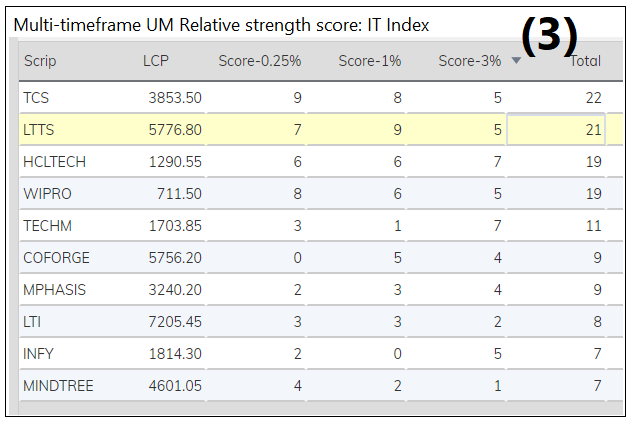
3) Outperformer of Multi-timeframe peer-RS studies
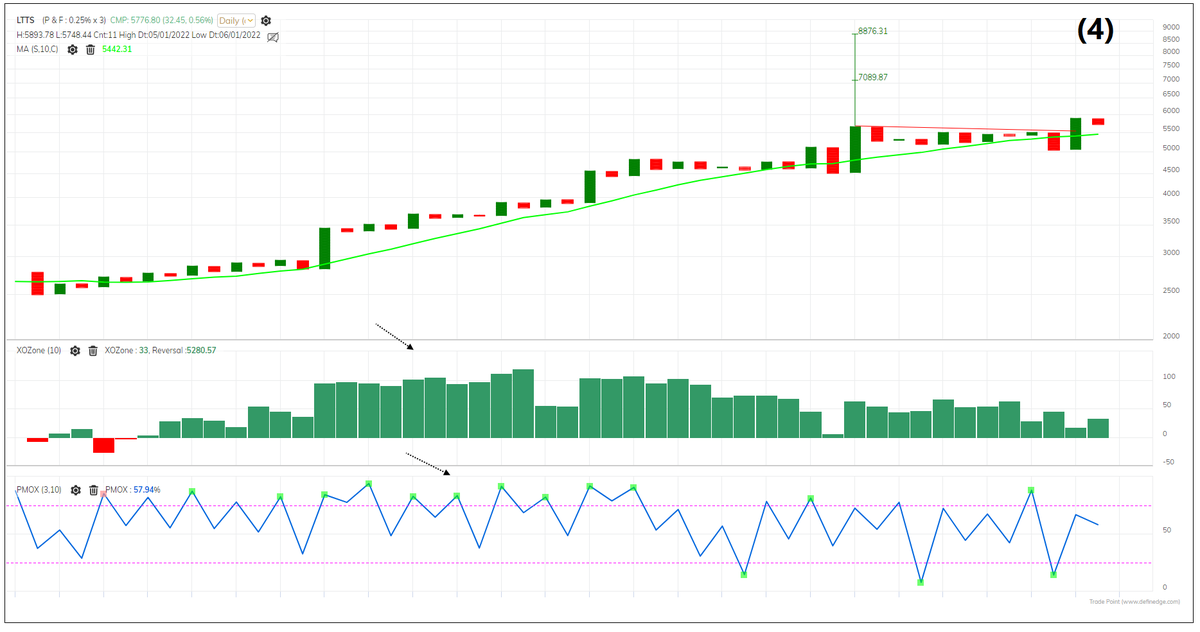
4) Series of bullish bars, dots and continuation patterns
1) Highest reading in RS indicator of IT Index. High returns & ratio rank – Outperformer
2) False trend line break & bullish RS pattern
3) Outperformer of Multi-timeframe peer-RS studies
4) Series of bullish bars, dots and continuation patterns
Another example of continuation pattern:
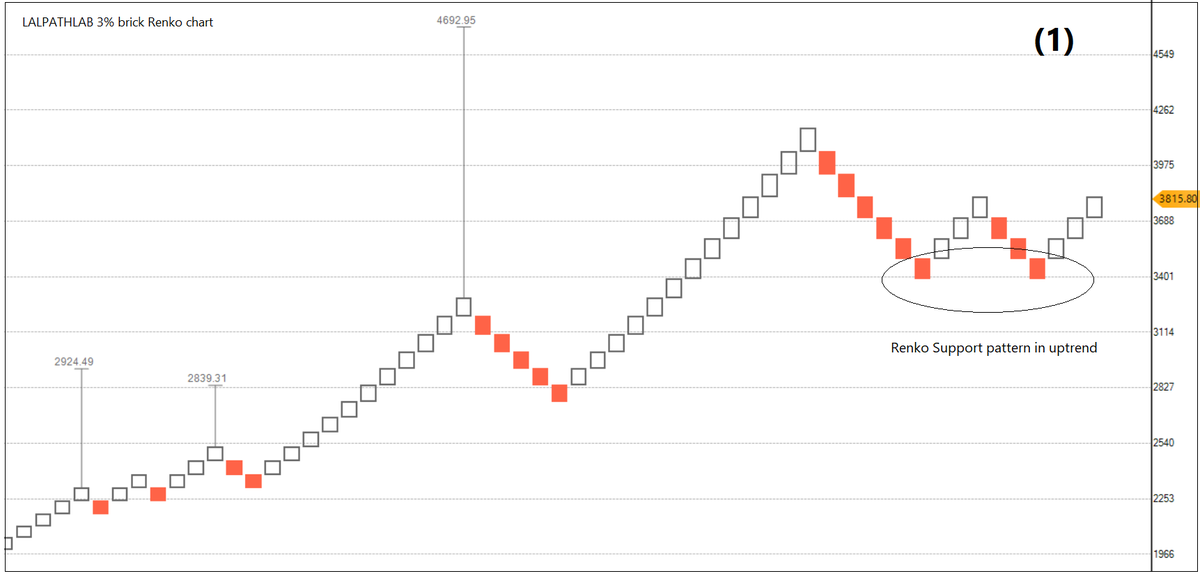
1) Support pattern in strong uptrend
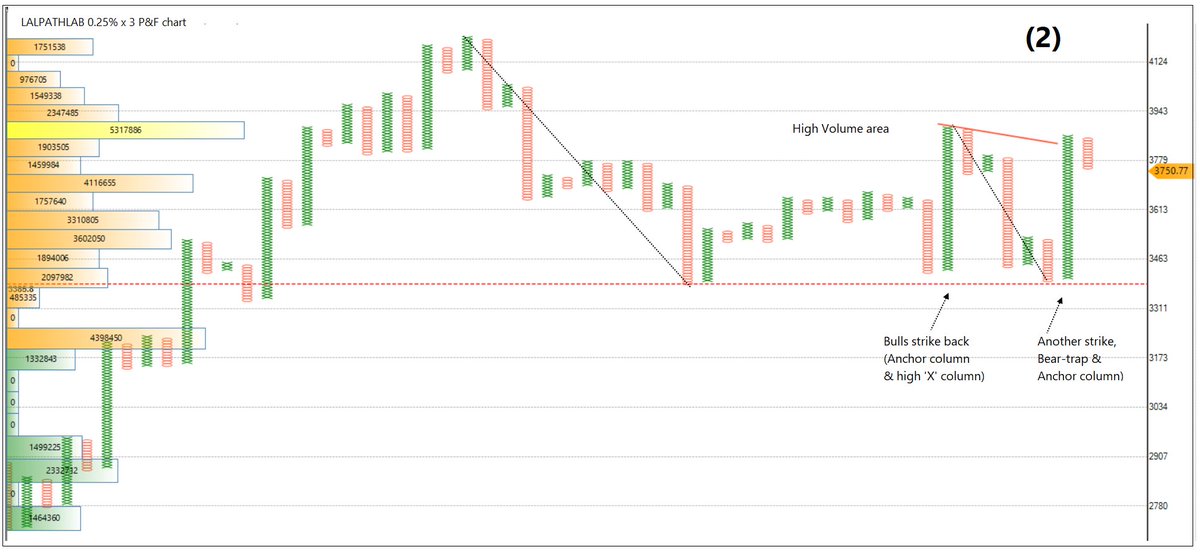
2) Downtrend but bears are not being able to succeed. Consecutive bullish Anchor strikes. Near High volume area, follow-through is trade-able if risk is affordable.
1) Support pattern in strong uptrend
2) Downtrend but bears are not being able to succeed. Consecutive bullish Anchor strikes. Near High volume area, follow-through is trade-able if risk is affordable.
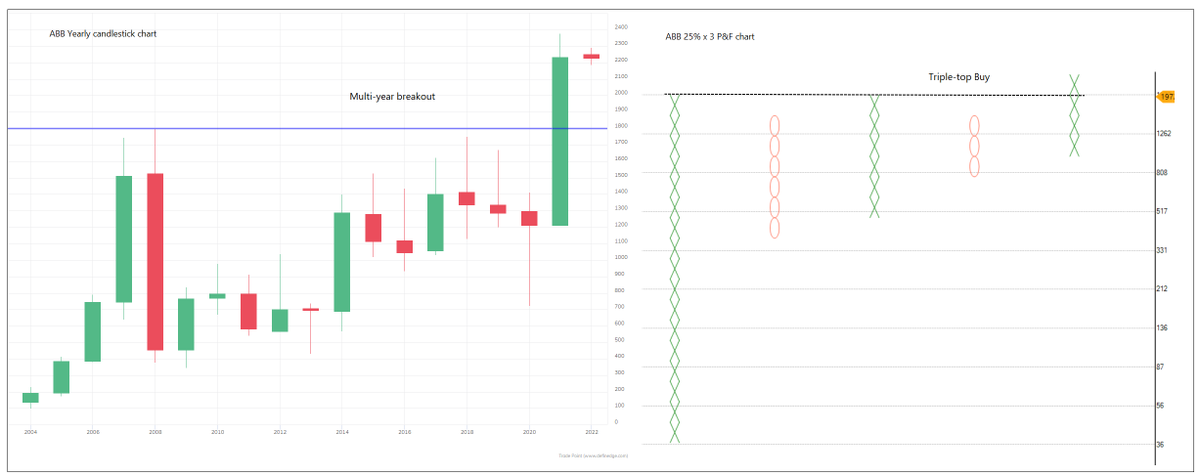
Example of consolidation pattern in short-term, significant long-term breakout.
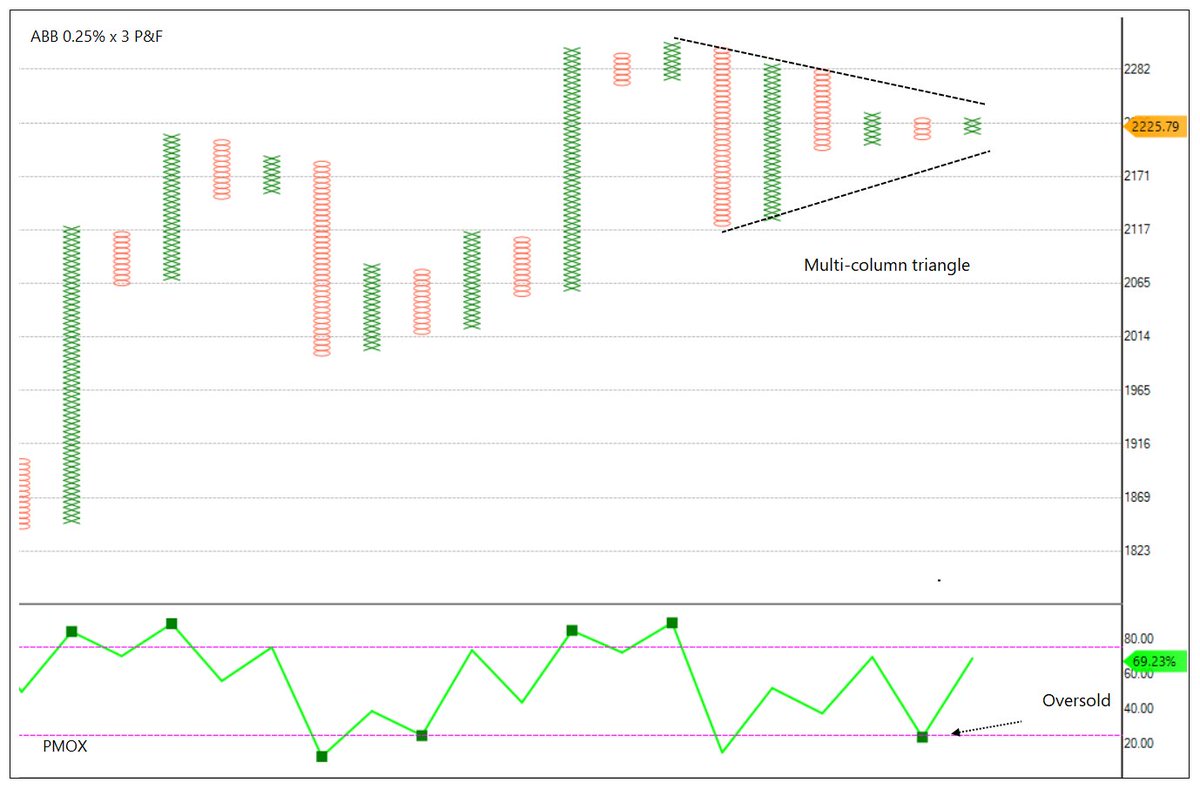
1) Multi-column triangle. Rare consolidation pattern.
Should look for bullish breakout, why?
1) Oversold zone
2) Multi-year breakout (Monthly candlestick). Triple-top multi-column breakout (25%).
1) Multi-column triangle. Rare consolidation pattern.
Should look for bullish breakout, why?
1) Oversold zone
2) Multi-year breakout (Monthly candlestick). Triple-top multi-column breakout (25%).
Self-explanatory if above charts are studied :-)
Loading suggestions...