

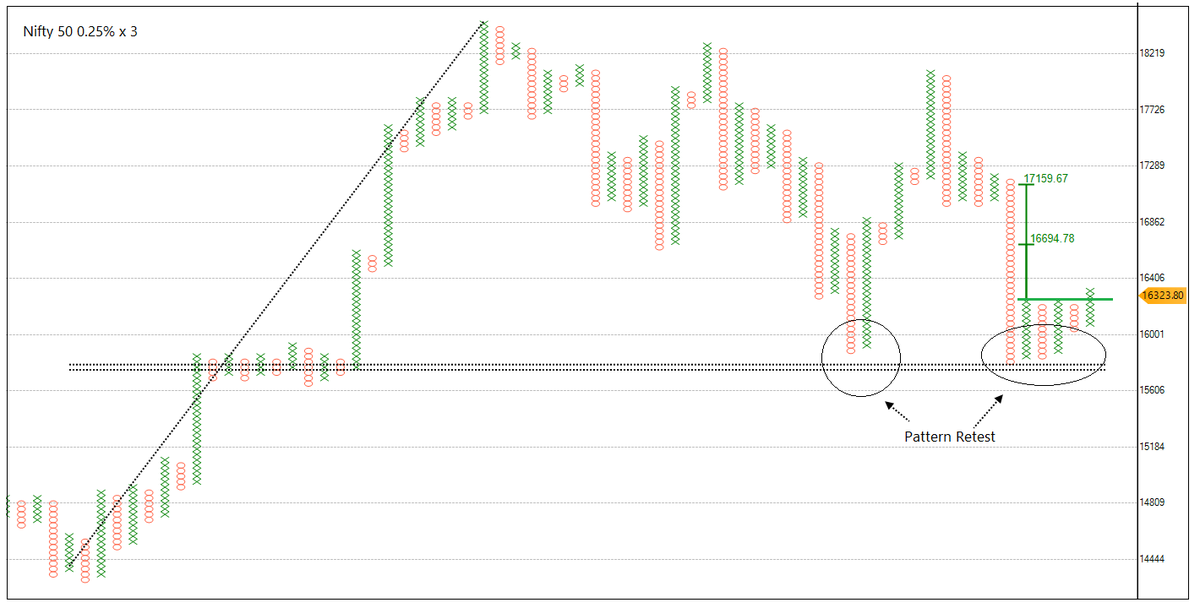
Nifty charts:
Reversal from Anchor point was followed by some sideways & volatile trend. Triple-top buy bullish pattern got triggered near previous bottom, I call it bullish pattern retest formation.
Bullish count got opened but trend is still down.
Reversal from Anchor point was followed by some sideways & volatile trend. Triple-top buy bullish pattern got triggered near previous bottom, I call it bullish pattern retest formation.
Bullish count got opened but trend is still down.
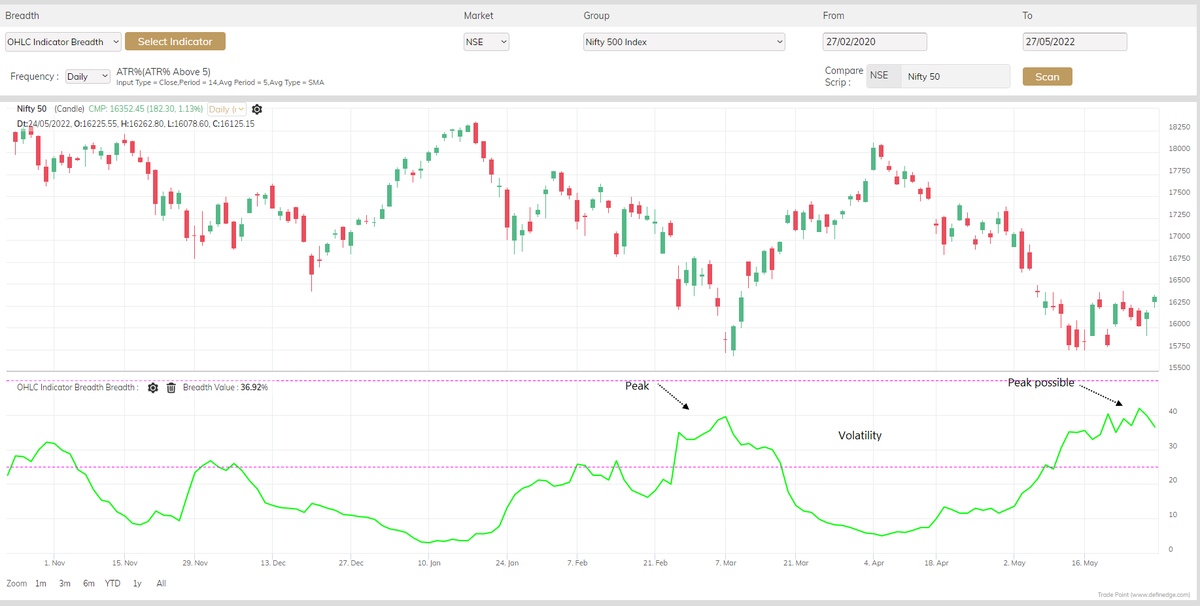
ATR (5%) breadth indicator of Nifty 500 stocks is near peak and showing chances of turning down. There is a possibility that volatility will reduce. Breakouts are expected to work well in that scenario.
Good for bulls if Triple-top breakout pattern remains active.
Good for bulls if Triple-top breakout pattern remains active.
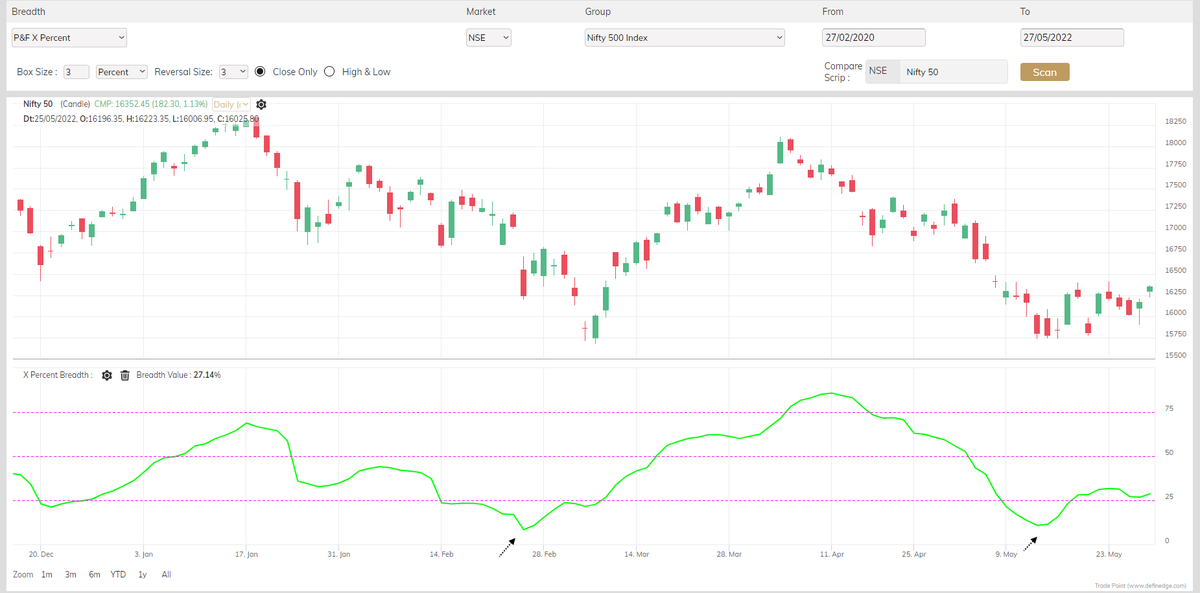
Long-term breadth (X-3%) turning bullish and seems to be settling above 25. Meaning, more stocks in Nifty 500 index are turning to bullish swing.
Short-term breadth is not overbought. (Bullish).
Short-term breadth is not overbought. (Bullish).
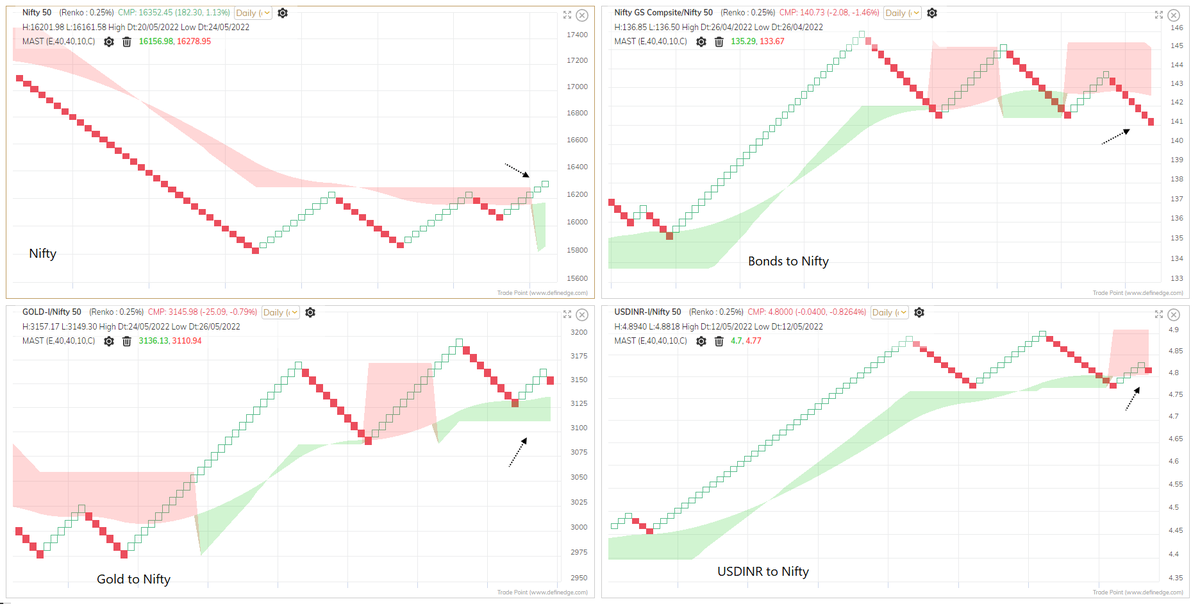
Renko RS charts of other asset classes to Nifty.
There are some signs of outperformance of Nifty in short-term.
The trend is yet to turn bullish. Short-term pattern is bullish if 16k remains protected. Candidates having follow-through patterns would be interesting.
There are some signs of outperformance of Nifty in short-term.
The trend is yet to turn bullish. Short-term pattern is bullish if 16k remains protected. Candidates having follow-through patterns would be interesting.
Loading suggestions...