

Retail sales showed weak Nov & Dec, though since its nominal, the composition doesn't match CPI, and prices are moving around important to try to get the right deflators. Below is my cut. All numbers are not annualized. Take in thread.
First of all this is an exercise is imprecision. These CPI categories don't match perfectly, but these are the ones that look closest.
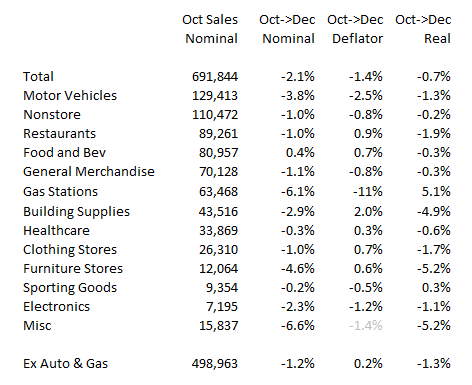
Overall a lot of decline explained by falling prices, but that might be over explained by gas prices falling too much here.
Overall a lot of decline explained by falling prices, but that might be over explained by gas prices falling too much here.
Ex autos and gas the decline looks mostly real. Under the hood, biggest declines in housing related areas (sensible).
General merchandise looks flatter in real terms which seems consistent with what Redbook suggested as well.
General merchandise looks flatter in real terms which seems consistent with what Redbook suggested as well.
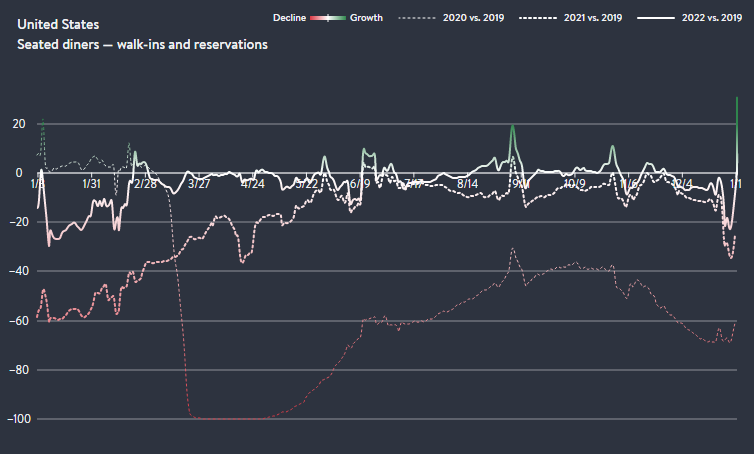
Restaurants weakness is also notable. While always seasonally weak around the holidays does seem to have collapsed vs. normal in mid Dec.
Notably picked up in last week of Dec and to start the year averaging 2% above 2019 levels so far in Jan (not shown). Lot better than 22.
Notably picked up in last week of Dec and to start the year averaging 2% above 2019 levels so far in Jan (not shown). Lot better than 22.
Suggests we are seeing some amount of the housing slowdown and falling gas and auto prices in here.
More generalized real goods demand is closer to zero, which is soft but not nearly as bad as the disastrous reads out there. Restaurants looks a little fluky.
More generalized real goods demand is closer to zero, which is soft but not nearly as bad as the disastrous reads out there. Restaurants looks a little fluky.
And for what its worth that take is a lot more consistent with what we are seeing more broadly in the economy. Weak housing, prices for gas and autos falling. Roughly zero real general goods demand as it stabilizes after being way above trend post-covid.
Loading suggestions...