

An old rule-of-thumb for bond traders is to buy the 2-year bond just after the second-to-last rate hike.
How well has this worked?
A STUDY of buying short bonds throughout history (1977-2023).
This study puts today's yield curve inversion and the 80s into context.
1/
How well has this worked?
A STUDY of buying short bonds throughout history (1977-2023).
This study puts today's yield curve inversion and the 80s into context.
1/
2/ NOTE:
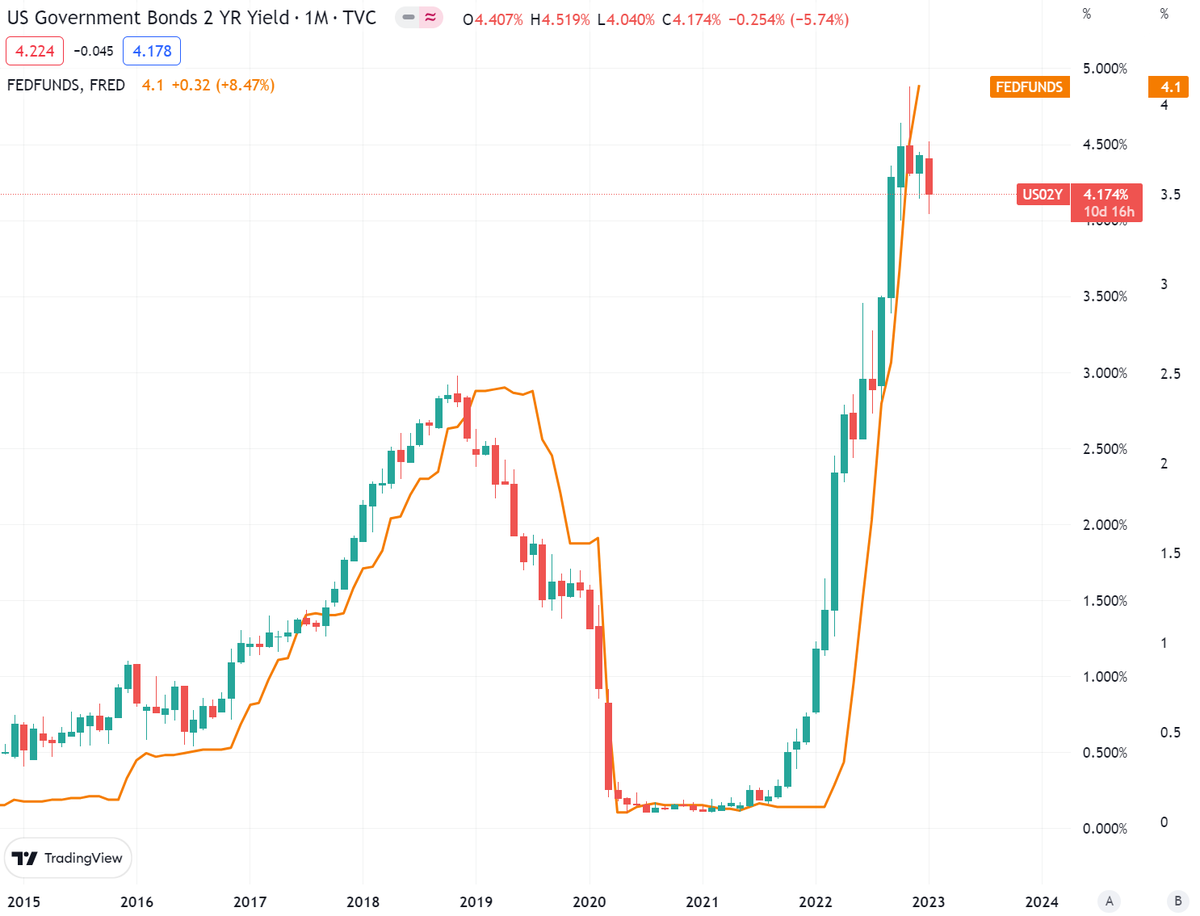
This analysis is on the 1y1y forward rate, i.e. you are taking a position in the expected 1 year rate in 1 years time.
This is roughly equivalent to buying the 2 year bond now, and selling it in 1 year's time.
DON'T do analysis just on the 2 year yield.
Here we go...
This analysis is on the 1y1y forward rate, i.e. you are taking a position in the expected 1 year rate in 1 years time.
This is roughly equivalent to buying the 2 year bond now, and selling it in 1 year's time.
DON'T do analysis just on the 2 year yield.
Here we go...
3/ Late 70s and 80s. Many hikes and cuts. Tough to call second to last hike each time, but if you did, these are results (better than you think, I was quite surprised).
Date is second to last hike date. You receive 1y1y at the end of the next session (the levels are on this day)
Date is second to last hike date. You receive 1y1y at the end of the next session (the levels are on this day)
4/
8-Oct-79
Fed funds: 13% hiked from 11.5%
1y1y rate at 9.97%, 3.03% (!!!) lower than FF
A trade buying bonds would LOSE 1.23% on this trade. ❌
Not that bad considering inversion. Note that fed funds was much lower at 11% at the end of this trade, and it still lost.
8-Oct-79
Fed funds: 13% hiked from 11.5%
1y1y rate at 9.97%, 3.03% (!!!) lower than FF
A trade buying bonds would LOSE 1.23% on this trade. ❌
Not that bad considering inversion. Note that fed funds was much lower at 11% at the end of this trade, and it still lost.
5/
15-Feb-1980
Fed funds: 15% hiked from 14%
1y1y rate at 13.54%, 1.46% lower than FF
A trade buying bonds would PROFIT 0.43% on this trade. ✅
Fed funds was to 20% (!!!!!) 1 year later, and yet this trade profits. Incredible.
15-Feb-1980
Fed funds: 15% hiked from 14%
1y1y rate at 13.54%, 1.46% lower than FF
A trade buying bonds would PROFIT 0.43% on this trade. ✅
Fed funds was to 20% (!!!!!) 1 year later, and yet this trade profits. Incredible.
6/
21-Nov-1980
Fed funds: 18% hiked from 12% (!)
1y1y rate at 13.22%, 4.88% (!!!) lower than FF
A trade buying bonds would PROFIT 0.23% on this trade. ✅
Again, crazy that this still profited, despite incredible inversion and a Fed funds at 20% the next year!
21-Nov-1980
Fed funds: 18% hiked from 12% (!)
1y1y rate at 13.22%, 4.88% (!!!) lower than FF
A trade buying bonds would PROFIT 0.23% on this trade. ✅
Again, crazy that this still profited, despite incredible inversion and a Fed funds at 20% the next year!
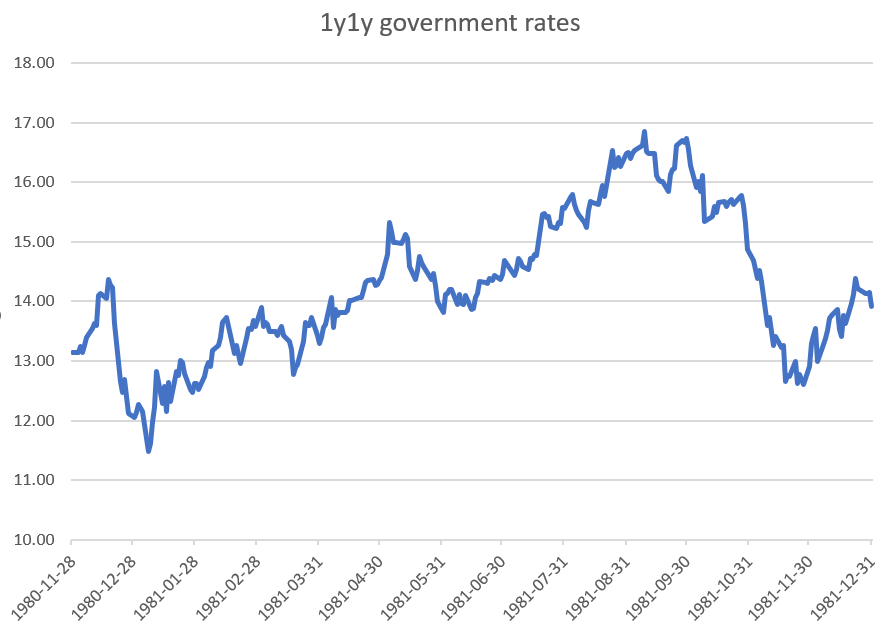
7/ A note on 1980/81.
Fed Funds went to 20% in Mar-80, fell to 8.5% in Jun-80 and got to 20% in Dec-80.
It then oscillated between 16% to 20%, ending in May-81.
1y1y rates did not peak until the Oct-81!
Fed Funds went to 20% in Mar-80, fell to 8.5% in Jun-80 and got to 20% in Dec-80.
It then oscillated between 16% to 20%, ending in May-81.
1y1y rates did not peak until the Oct-81!
8/ Despite this volatility, buying bonds in April, just after a CUT to 16% from 20%, and another raise to 20% coming STILL made you money....
In fact, buying anytime after this was profitable as in the chart below.
Something to learn here despite the heavy inversion...
In fact, buying anytime after this was profitable as in the chart below.
Something to learn here despite the heavy inversion...
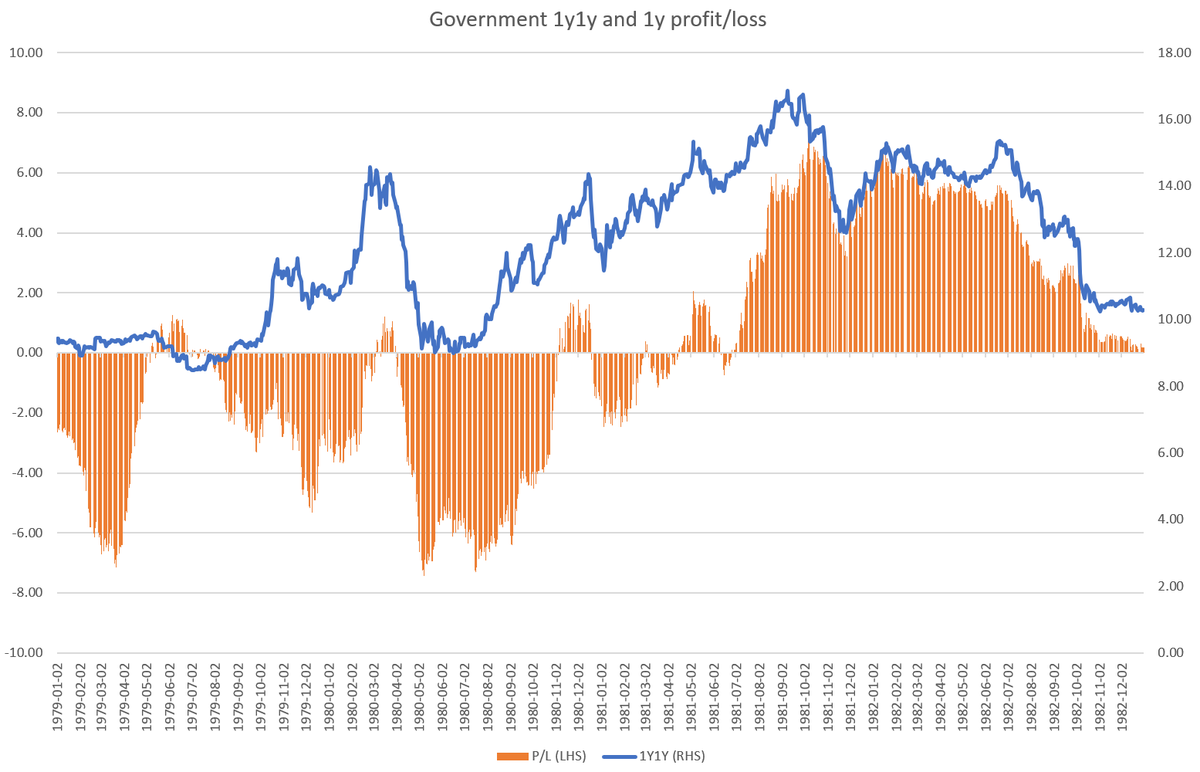
9/
28-Apr-1981
Fed funds: 16% hiked from 12% (!)
1y1y rate at 13.22%, 4.88% (!!!) lower than FF
A trade buying bonds would PROFIT 0.23% on this trade. ✅
Not big, and with a massive drawdown...but it still worked through another 2 oscillations up to 20%.
28-Apr-1981
Fed funds: 16% hiked from 12% (!)
1y1y rate at 13.22%, 4.88% (!!!) lower than FF
A trade buying bonds would PROFIT 0.23% on this trade. ✅
Not big, and with a massive drawdown...but it still worked through another 2 oscillations up to 20%.
10/
24-May-1983
Fed funds: 8.63% hiked from 8.5%
1y1y rate at 10.31%, 1.82% higher than FF
A trade buying bonds would LOSE 1.76% on this trade. ❌
Pretty big loss here. Inflation moved from low 3% to high 4% over this time, causing hikes in late '83, and losses on the trade.
24-May-1983
Fed funds: 8.63% hiked from 8.5%
1y1y rate at 10.31%, 1.82% higher than FF
A trade buying bonds would LOSE 1.76% on this trade. ❌
Pretty big loss here. Inflation moved from low 3% to high 4% over this time, causing hikes in late '83, and losses on the trade.
11/
17-Jul-1984
Fed funds: 11% hiked from 10.5%
1y1y rate at 13.78%, 2.78% higher than FF
A trade buying bonds would PROFIT 4.13% on this trade. ✅
Massive profit here. This one has nailed the end of the hiking cycle.
NOTE that the 1y1y rate was WAY higher than fed funds.
17-Jul-1984
Fed funds: 11% hiked from 10.5%
1y1y rate at 13.78%, 2.78% higher than FF
A trade buying bonds would PROFIT 4.13% on this trade. ✅
Massive profit here. This one has nailed the end of the hiking cycle.
NOTE that the 1y1y rate was WAY higher than fed funds.
12/
19-May-1987
Fed funds: 6.5% hiked from 5.88%
1y1y rate at 8.88%, 3.33% higher than FF
A trade buying bonds would PROFIT 1.43% on this trade. ✅
Steep yield curve makes profits big again.
19-May-1987
Fed funds: 6.5% hiked from 5.88%
1y1y rate at 8.88%, 3.33% higher than FF
A trade buying bonds would PROFIT 1.43% on this trade. ✅
Steep yield curve makes profits big again.
13/
14-Dec-1988
Fed funds: 8.38% hiked from 8.13%
1y1y rate at 9.22%, 0.86% higher than FF
A trade buying bonds would PROFIT 1.57% on this trade. ✅
Another good one, but once again a positive slope yield curve.
14-Dec-1988
Fed funds: 8.38% hiked from 8.13%
1y1y rate at 9.22%, 0.86% higher than FF
A trade buying bonds would PROFIT 1.57% on this trade. ✅
Another good one, but once again a positive slope yield curve.
14/
21-Mar-2000
Fed funds: 6% hiked from 5.75%
1y1y rate at 6.79%, 0.79% higher than FF
A trade buying bonds would PROFIT 2.69% on this trade. ✅
Big profit, but positive sloped yield curve again.
21-Mar-2000
Fed funds: 6% hiked from 5.75%
1y1y rate at 6.79%, 0.79% higher than FF
A trade buying bonds would PROFIT 2.69% on this trade. ✅
Big profit, but positive sloped yield curve again.
15/
10-May-2006
Fed funds: 5% hiked from 4.75%
1y1y rate at 4.99%, flat to FF
A trade buying bonds would PROFIT 0.13% on this trade. ✅
Not so good, given what was coming. GFC didn't take hold until much later.
10-May-2006
Fed funds: 5% hiked from 4.75%
1y1y rate at 4.99%, flat to FF
A trade buying bonds would PROFIT 0.13% on this trade. ✅
Not so good, given what was coming. GFC didn't take hold until much later.
16/
27-Sep-2018
Fed funds: 2.25% hiked from 2%
1y1y rate at 3.03%, 0.78% higher than FF
A trade buying bonds would PROFIT 1.36% on this trade. ✅
Solid gain, helped by the Fed switching to cutting very quickly. Another positively sloped curve.
27-Sep-2018
Fed funds: 2.25% hiked from 2%
1y1y rate at 3.03%, 0.78% higher than FF
A trade buying bonds would PROFIT 1.36% on this trade. ✅
Solid gain, helped by the Fed switching to cutting very quickly. Another positively sloped curve.
17/ How does this compare to today?
1-Feb-2023
Fed funds: 4.75% hiked from 4.5% (?)
1y1y rate at 3.53% (now), 1.22% LOWER than FF
Which period does this compare to best?
1-Feb-2023
Fed funds: 4.75% hiked from 4.5% (?)
1y1y rate at 3.53% (now), 1.22% LOWER than FF
Which period does this compare to best?
18/ I think we have to ignore the more recent examples from the 2000s, as they all occurred with a positive sloped yield curve, providing a lot of insurance against getting it wrong.
19/ So that leaves the '80s.
Out of 8 trades, 2 lost money. They were split evenly between inverted and positively sloped.
An interesting take away is that the winners were evenly split between being inverted and positive sloped.
Out of 8 trades, 2 lost money. They were split evenly between inverted and positively sloped.
An interesting take away is that the winners were evenly split between being inverted and positive sloped.
20/ The inverted cases are roughly equivalent to what we have today (2 times the yield = 2 times the inversion), so it is consistent.
21/ CONCLUSION
* The inversion of the curve shouldn't bother you, something that surprised me and went against my post 2005 trader training.
* Whether the trade makes money or not will depend on where monthly inflation rate is in a years' time. Obvious, but important.
* The inversion of the curve shouldn't bother you, something that surprised me and went against my post 2005 trader training.
* Whether the trade makes money or not will depend on where monthly inflation rate is in a years' time. Obvious, but important.
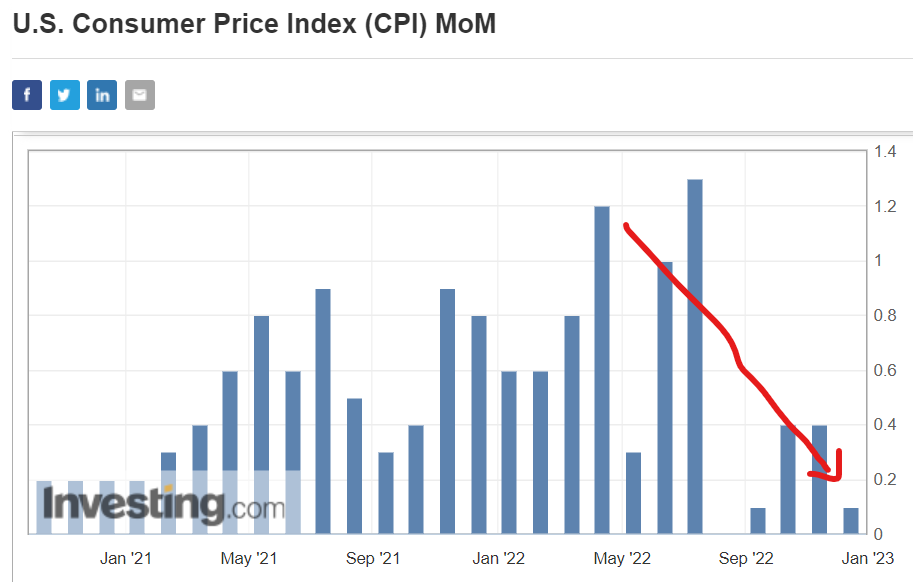
22/ The second point might be obvious, but the cautionary tale is is the big May-1983 loss.
Monthly inflation prints came down a lot, slowing down hikes.
Sound familiar?
Start of '84, it spikes again. Fed freaks, hikes to 11.5% over the next year.
Monthly inflation prints came down a lot, slowing down hikes.
Sound familiar?
Start of '84, it spikes again. Fed freaks, hikes to 11.5% over the next year.
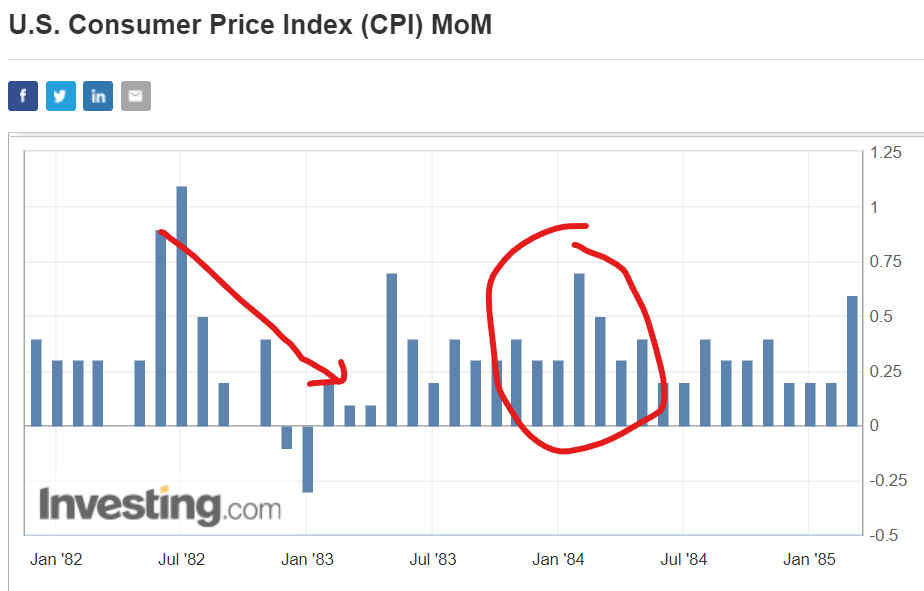
23/ In this cycle we see the same process as in early 1983. 1979 can be ignored, as we are already in an inflation falling regime.
24/ TRADE:
Buying short-maturity bonds (or forwards) after the next Fed hike has a high chance of winning, BUT the heavy inversion means that there is ZERO insurance against CPI picking up again.
This is the historical experience, with the best analogue being the '80s.
Buying short-maturity bonds (or forwards) after the next Fed hike has a high chance of winning, BUT the heavy inversion means that there is ZERO insurance against CPI picking up again.
This is the historical experience, with the best analogue being the '80s.
A guide to (inflationary) money printing
Learn how CB can create debasement (and it's not QE that does it)
macroisdead.com
Learn how CB can create debasement (and it's not QE that does it)
macroisdead.com
Loading suggestions...