

A different way to use indicators.
Besides price trends, technical indicators can also help us identify outperformance and underperformance.
Thread
#RSI #trading #investing
Besides price trends, technical indicators can also help us identify outperformance and underperformance.
Thread
#RSI #trading #investing
A ratio chart is a type of chart that looks like a line chart but is a ratio of two instruments.
A line chart is plotted by connecting the closing prices of an instrument.
Ratio chart is a line chart that connects the ratio of the prices of two instruments.
A line chart is plotted by connecting the closing prices of an instrument.
Ratio chart is a line chart that connects the ratio of the prices of two instruments.
If price of instrument A is 200 and B is 100, ratio is 2.
For a daily timeframe ratio chart, this ratio is calculated daily and plotted as a ratio chart.
Below is a ratio chart of Nifty v/s Bank Nifty.
For a daily timeframe ratio chart, this ratio is calculated daily and plotted as a ratio chart.
Below is a ratio chart of Nifty v/s Bank Nifty.
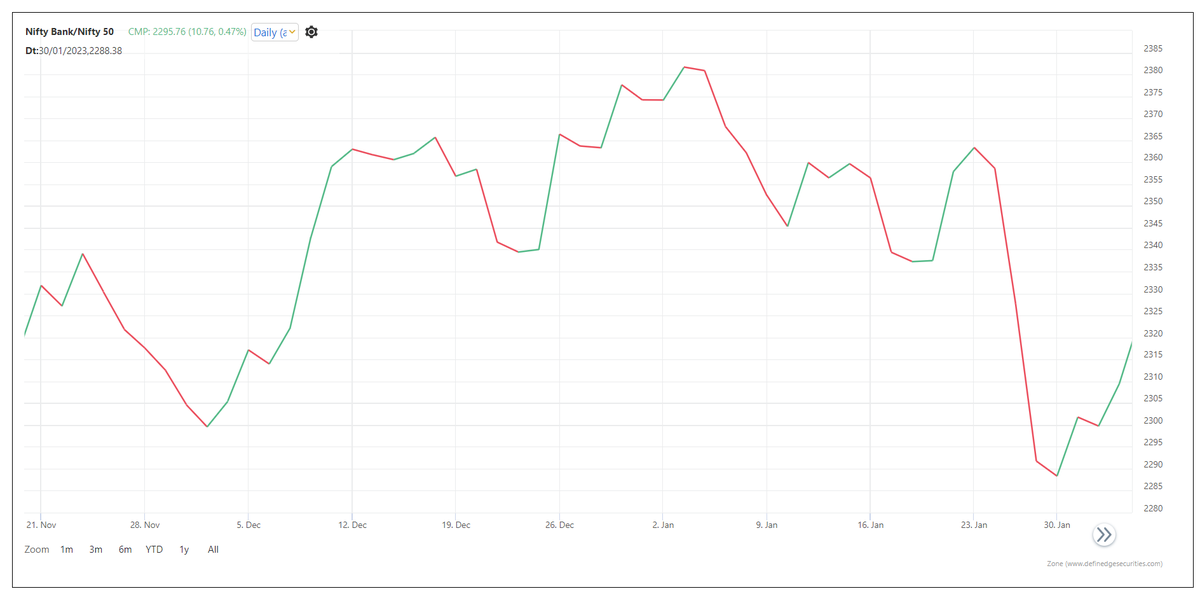
Bank Nifty is a numerator and Nifty is the denominator. So the chart shows the performance of Bank nifty.
There are many ways to analyse these charts.
This subject is explained in detail in my book, Outperforming the Markets Using Relative Strength and Breadth Analysis.
There are many ways to analyse these charts.
This subject is explained in detail in my book, Outperforming the Markets Using Relative Strength and Breadth Analysis.
We can also plot indicators on a ratio chart.
Let’s take an example of the RSI since it is a popular & widely followed indicator.
When we plot RSI on a price chart, it calculates the ratio of bullish price changes. As RSI increases, it indicates a stronger bullish price ratio.
Let’s take an example of the RSI since it is a popular & widely followed indicator.
When we plot RSI on a price chart, it calculates the ratio of bullish price changes. As RSI increases, it indicates a stronger bullish price ratio.
For RSI on ratio chart - instead of price, the input is ratio. The formula is the same.
The RSI indicator is a ratio of bullish prices. On the Ratio chart, it becomes the ratio of a ratio!
Think,
What does the RSI indicator calculate here?
The RSI indicator is a ratio of bullish prices. On the Ratio chart, it becomes the ratio of a ratio!
Think,
What does the RSI indicator calculate here?
RSI on the price chart:
Bullish price = higher than the prev close (price moved up)
Bearish price = lower close (price declined)
A bullish price on the ratio chart implies that the ratio has increased.
That happens when the numerator outperforms the denominator in that session
Bullish price = higher than the prev close (price moved up)
Bearish price = lower close (price declined)
A bullish price on the ratio chart implies that the ratio has increased.
That happens when the numerator outperforms the denominator in that session
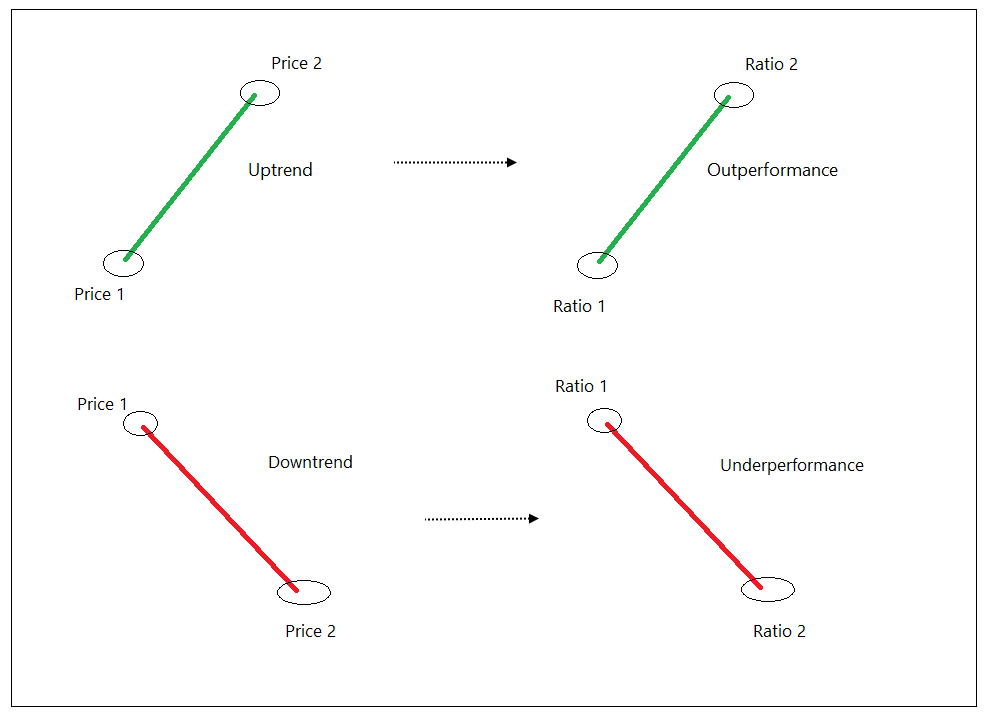
When the ratio turns lower, that means the numerator underperformed in that session.
So, the RSI on the ratio chart calculates the ratio of outperformance of the numerator.
When the RSI is bullish, it indicates that the ratio chart will be bullish (Outperformance of numerator).
So, the RSI on the ratio chart calculates the ratio of outperformance of the numerator.
When the RSI is bullish, it indicates that the ratio chart will be bullish (Outperformance of numerator).
When you look at the RSI indicator on a ratio chart, you will notice that the curves of the indicator are the same as those of the ratio chart.
Therefore, it actually converts the ratio into an oscillator that ranges from 0 to 100.
Therefore, it actually converts the ratio into an oscillator that ranges from 0 to 100.
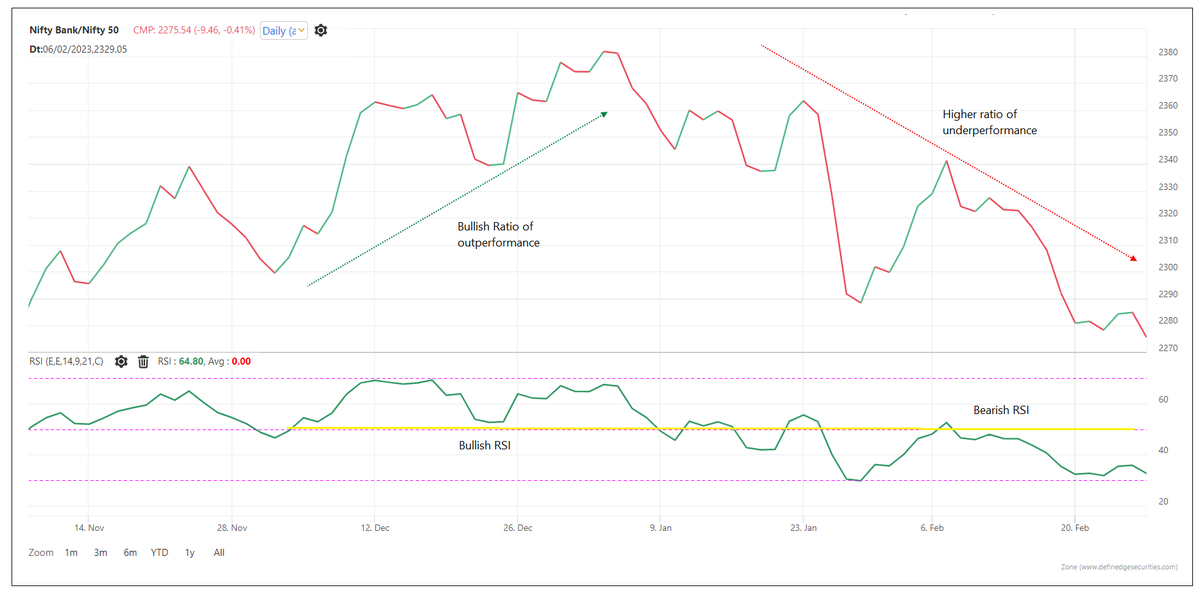
In other words, RSI of a ratio chart above 50 indicates outperformance, and RSI below 50 indicates underperformance.
All methods of reading RSI are applicable to ratio charts as well. Range rules of 40 - 60 (variation of 50), Positive & negative divergences are also effective.
All methods of reading RSI are applicable to ratio charts as well. Range rules of 40 - 60 (variation of 50), Positive & negative divergences are also effective.

Remember, however, the calculation is based on a ratio, so the analysis is of the performance trend, not the price trend.
A rising ratio doesn’t necessarily mean that the price of the numerator will increase. It means that the numerator is outperforming the denominator.
A rising ratio doesn’t necessarily mean that the price of the numerator will increase. It means that the numerator is outperforming the denominator.
Ratio chart indicators provide insight into when an instrument can outperform. An entry and exit point can be determined by a price chart.
I wrote about removing noise from the RSI indicator in my last thread.
How about noiseless ratio RSI?
I wrote about removing noise from the RSI indicator in my last thread.
How about noiseless ratio RSI?
Convert ratio chart to P&F ratio chart. It is P&F RS chart. It becomes a swing chart of ratio.
Plot RSI on that chart.
So, it removes noise from the ratio as well as RSI. Below is a RSI of ratio chart and P&F chart of the same instrument.
Plot RSI on that chart.
So, it removes noise from the ratio as well as RSI. Below is a RSI of ratio chart and P&F chart of the same instrument.

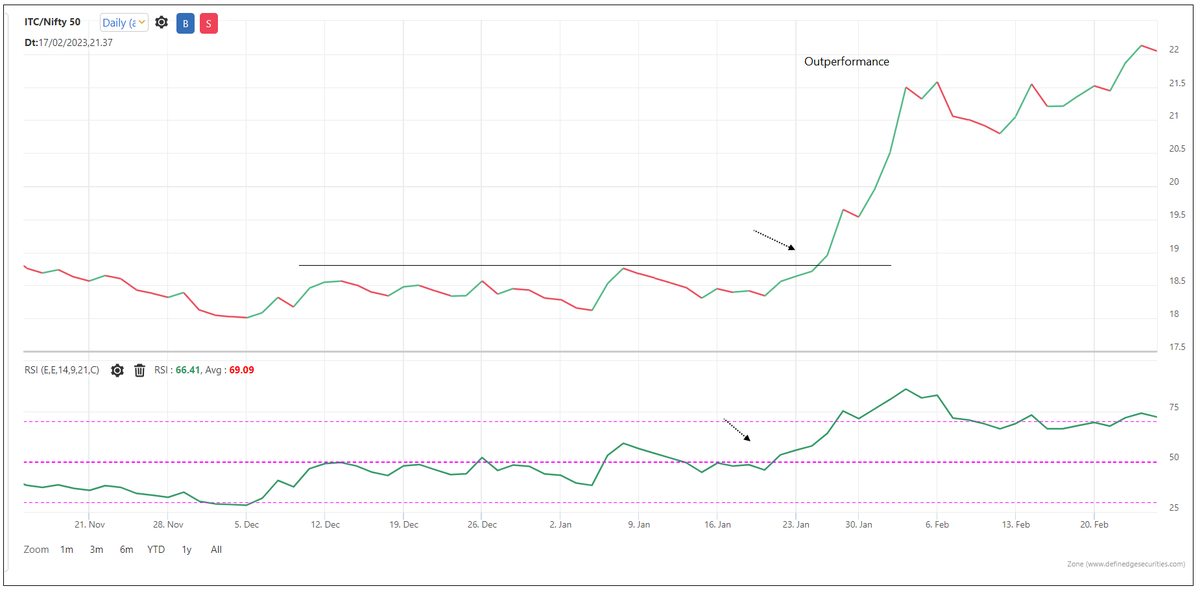
This method can be helpful in identifying stocks. Stocks turning bullish on ratio charts indicate outperformance.
Below is an example of ITC. (Hindsight, but a recent example of outperformance).
ITC ratio turns bullish.
Below is an example of ITC. (Hindsight, but a recent example of outperformance).
ITC ratio turns bullish.
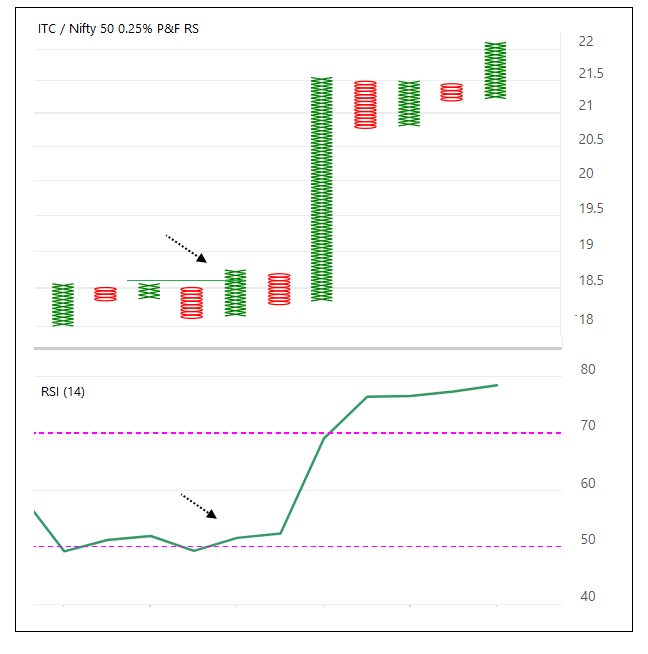
Same chart in P&F format. It removes noise from both - ratio and indicator.
Also observe how simple price patterns are effective on RS charts as well.
A bullish price breakout here means the instrument can outperform.
Also observe how simple price patterns are effective on RS charts as well.
A bullish price breakout here means the instrument can outperform.
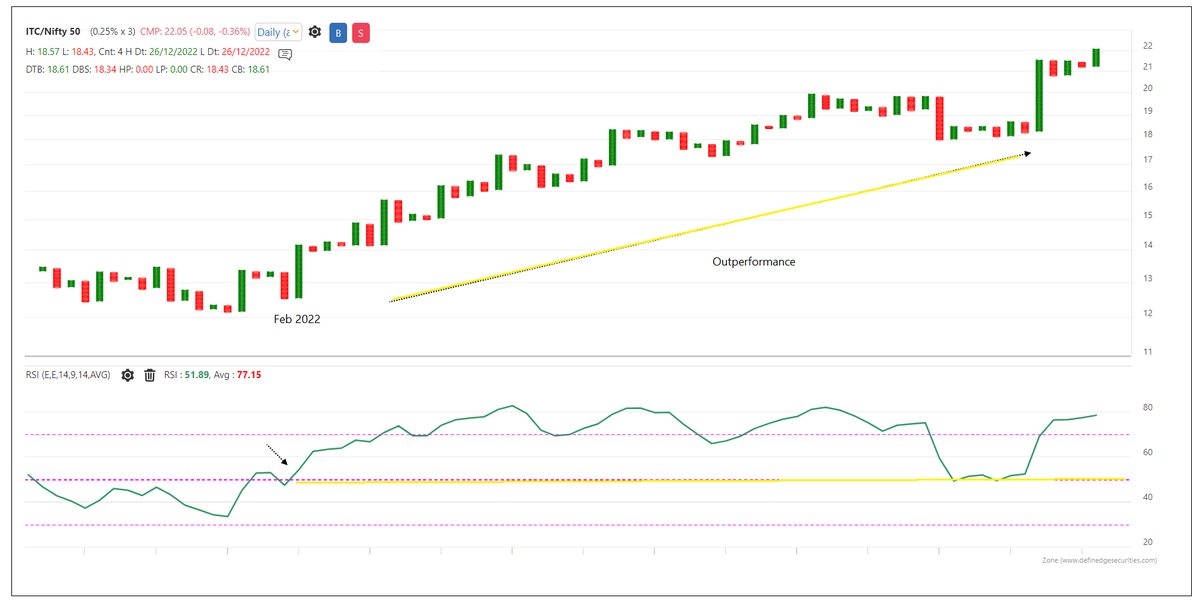
Below is a one-year relative strength (ratio) chart of ITC showing outperformance.
Noiseless Ratio and RSI analysis 😊
Noiseless Ratio and RSI analysis 😊
RSI was discussed as an example. Any other indicator can also be plotted on a ratio or P&F RS chart.
Indicators on price chart = analyse price trends
Indicators on RS = analyse performance trends
How about a strategy that combines both?
Think and explore
Thank you for reading
Indicators on price chart = analyse price trends
Indicators on RS = analyse performance trends
How about a strategy that combines both?
Think and explore
Thank you for reading
Loading suggestions...