
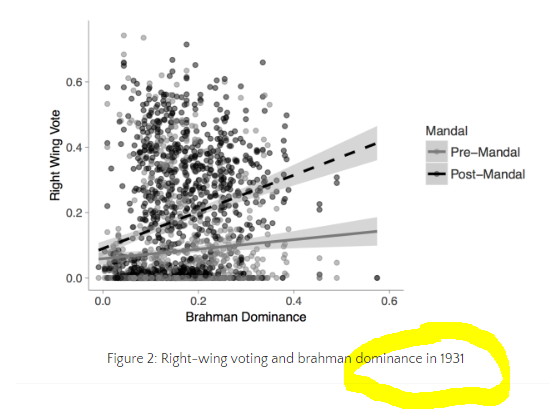
Hey! This chart is confusing to say the least. On your blog post, the title of the chart says - "Figure 2: Right-wing voting and brahman dominance in 1931". Is it 1991 actually? Moreover, you haven't given the R-squared values (standard practice with regression). Please revise
I am embedding the archive link for this post here for folks to verify - web.archive.org
Have a look at what that 'glorified' image actually looks like.
Loading suggestions...