

It's hard to know where any economy is going.
But if you want to start predicting where the macro economy will go in the next 3-6m, here are the 13 key indicators to track that will give you a head start. 👇
But if you want to start predicting where the macro economy will go in the next 3-6m, here are the 13 key indicators to track that will give you a head start. 👇
To understand how any economy will play out in the future, it is important to consider where it is in its:
a) business cycle
b) long-term debt cycle
c) long-term productivity
Let’s take a look at what indicators are best to look at along these dimensions using the US today.
a) business cycle
b) long-term debt cycle
c) long-term productivity
Let’s take a look at what indicators are best to look at along these dimensions using the US today.
Business cycles are the normal expansion and contraction of economic activity typically driven by monetary policy.
To visualize forward you have to know where you are in the cycle, the momentum, and what pressure policy/financial conditions are putting on the economy.
To visualize forward you have to know where you are in the cycle, the momentum, and what pressure policy/financial conditions are putting on the economy.
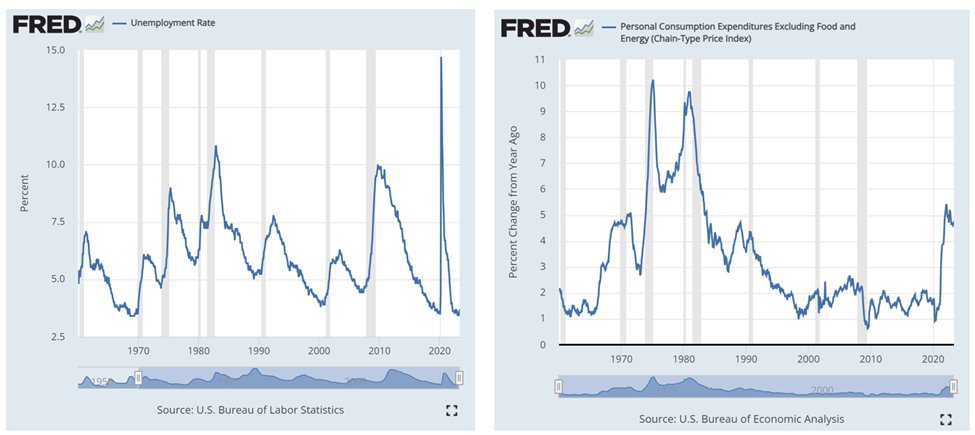
The two best indicators to understand where an economy stands in the business cycle are
1/ unemployment rate
2/ core inflation
The combination of these two factors tell you whether the economy is running hot, neutral, or cold.
1/ unemployment rate
2/ core inflation
The combination of these two factors tell you whether the economy is running hot, neutral, or cold.
In the US today the business cycle is clearly *late cycle*
Unemployment is at secular lows and core inflation remains elevated vs. target.
Unemployment is at secular lows and core inflation remains elevated vs. target.
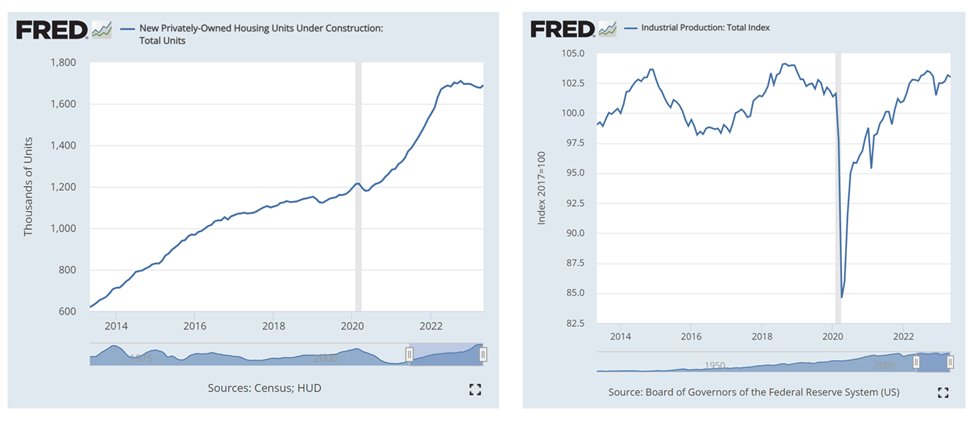
Next it's important to understand the momentum of the economy. That is best done by tracking the most cyclically sensitive sectors of the economy because those typically lead the rest of the economy.
Those best sectors to track are:
3/ Housing
4/ Manufacturing
Those best sectors to track are:
3/ Housing
4/ Manufacturing
In the last few months the US cyclical sectors' momentum is close to *neutral*
While both the housing sector and manufacturing slowed somewhat last year, they have largely stabilized this year and if anything picked up.
While both the housing sector and manufacturing slowed somewhat last year, they have largely stabilized this year and if anything picked up.
The final step is to understand policy & financial conditions because these dynamics can push an economy faster or slower.
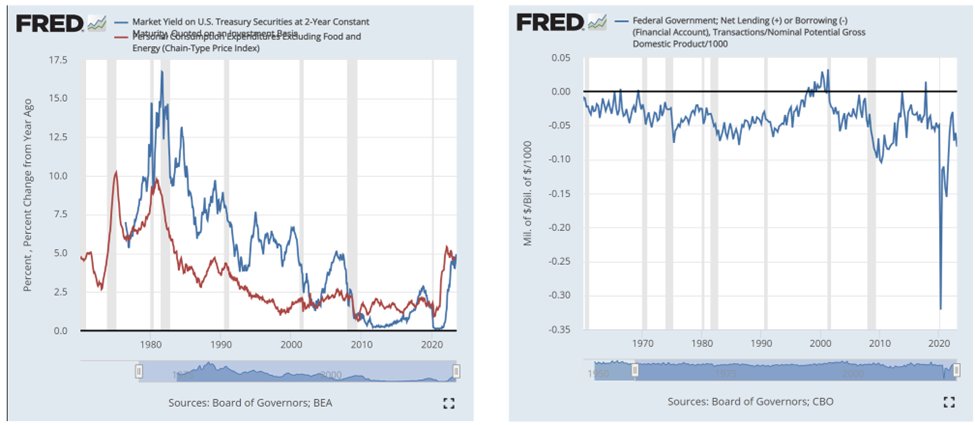
The best measures of policy conditions are:
5/ Short-term real interest rates
6/ Change in fiscal deficit
The best measures of policy conditions are:
5/ Short-term real interest rates
6/ Change in fiscal deficit
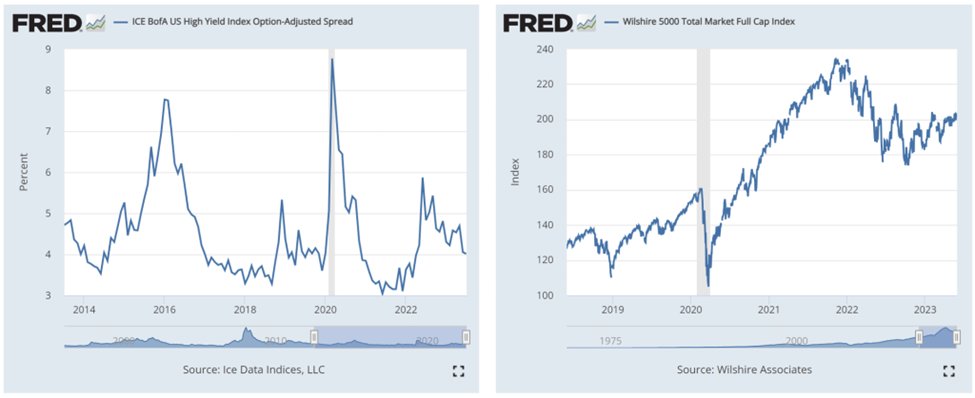
The best measures of financial conditions are:
7/ Stocks
8/ Credit spreads
7/ Stocks
8/ Credit spreads
If we look at the US policy today the pressure is *modestly tightening*
Short-term rates have risen but are only roughly at the level of core inflation and the deficit is widening modestly, but will likely contract as debt-ceiling related cuts come in the future.
Short-term rates have risen but are only roughly at the level of core inflation and the deficit is widening modestly, but will likely contract as debt-ceiling related cuts come in the future.
If we look at financial conditions in the US they look *modestly stimulative*
The stock market has rebounded substantially over the past 9 months and credit spreads remain relatively low in any historical context:
The stock market has rebounded substantially over the past 9 months and credit spreads remain relatively low in any historical context:
Put together cyclical dynamics in the US today are:
- Late cycle
- Neutral cyclical momentum
- Modestly tightening policy
- Slightly stimulative fin conditions
Typically this set of conditions normally leads to continued expansion at near potential GDP on a 3-6m fwd basis.
- Late cycle
- Neutral cyclical momentum
- Modestly tightening policy
- Slightly stimulative fin conditions
Typically this set of conditions normally leads to continued expansion at near potential GDP on a 3-6m fwd basis.
The Long-term debt cycle can be either a consistent drag or lift to economic activity that is somewhat independent of the cyclical dynamics at play.
If debts are low then HH, Biz, or the Gov can borrow more which in turn helps economic activity, or the opposite.
If debts are low then HH, Biz, or the Gov can borrow more which in turn helps economic activity, or the opposite.
But its not just about looking at the *level* of debt. What matters is if the debt can be serviced. So it's best to look at *debt service* relative to the ability to pay.
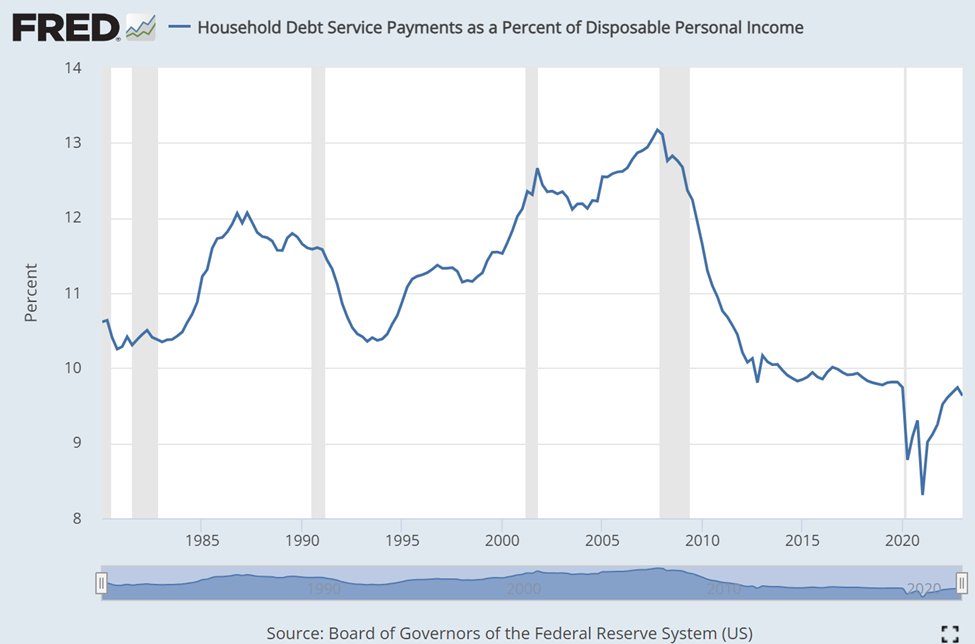
9/ HH debt svc to income
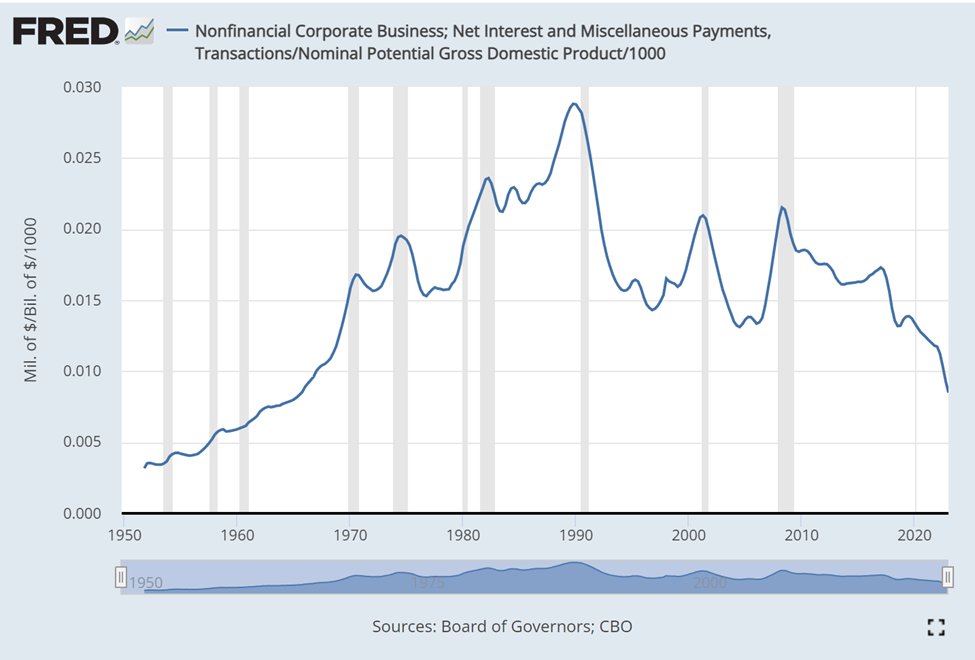
10/ Biz debt svc relative to GDP
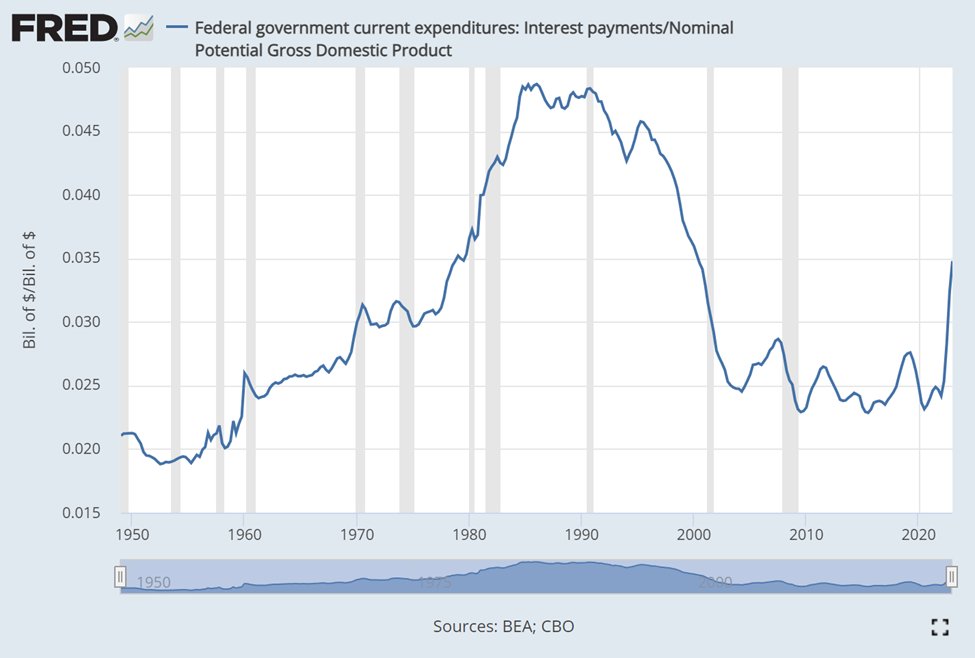
11/ Government interest expense to GDP
9/ HH debt svc to income
10/ Biz debt svc relative to GDP
11/ Government interest expense to GDP
In the US households debt service is a *modest positive*
These households had very high levels of debt service prior to the GFC which was an important drag on economic activity for decades. Now their debt service is low following refinancing to low rates.
These households had very high levels of debt service prior to the GFC which was an important drag on economic activity for decades. Now their debt service is low following refinancing to low rates.
In the US corporate debt service is a *modest positive*
Most corporations were able to refinance into low rates while rates were low.
Most corporations were able to refinance into low rates while rates were low.
In the US, government debt service is a *modest negative*
The US government borrowed significantly during COVID, which combined with rising rates means that debt service has been rising quickly and will be in line with 1980s levels if rates stay around 5% for an extended period.
The US government borrowed significantly during COVID, which combined with rising rates means that debt service has been rising quickly and will be in line with 1980s levels if rates stay around 5% for an extended period.
Put together the long term debt picture in the US looks
- HH is a modest support
- Corp is a modest support
- Gov is a modest drag
Typically countries with this composition the long-term debt cycle wouldn't have a big impact on growth outcomes in the near term.
- HH is a modest support
- Corp is a modest support
- Gov is a modest drag
Typically countries with this composition the long-term debt cycle wouldn't have a big impact on growth outcomes in the near term.
Finally both the cyclical dynamics and the long-term debt cycle dynamics drive an economy around a central growth rate (often called “potential”). This long-term economic trend is determined by:
12/ Working age population growth
13/ Productivity growth
12/ Working age population growth
13/ Productivity growth
In the US the long-term potential growth rate is *low* at about 1-1.5%.
Working age population growth is close to zero and productivity growth has been about 1% in the post-GFC period. Much more noted here:
Working age population growth is close to zero and productivity growth has been about 1% in the post-GFC period. Much more noted here:
When we put this all together for the US economy it looks like:
- Cyclically late cycle with roughly neutral momentum to maybe slightly weaker
- Long-term debt cycle with neutral pressure on cyclical conditions
- Long-term potential growth that is low vs history
- Cyclically late cycle with roughly neutral momentum to maybe slightly weaker
- Long-term debt cycle with neutral pressure on cyclical conditions
- Long-term potential growth that is low vs history
This adds up to a US economy that would typically grow roughly at potential to a tad softer than that over the next 3-6m given these indicators.
But because of the secular dynamics that modest growth may feel slow vs previous cycles.
But because of the secular dynamics that modest growth may feel slow vs previous cycles.
Of course any economy is more complex than the 13 indicators I've listed above.
This isn't intended to reflect all the things to think about or the important idiosyncratic dynamics that exist in individual economies.
This isn't intended to reflect all the things to think about or the important idiosyncratic dynamics that exist in individual economies.
Instead think of this as the starting point. 13 indicators that can be applied to any country in any time frame to get a head start on what might play out in the future.
And from there start to ask the important questions of what else may drive the future.
And from there start to ask the important questions of what else may drive the future.
In future posts we will apply the same framework to other countries to see how they might progress.
Loading suggestions...