


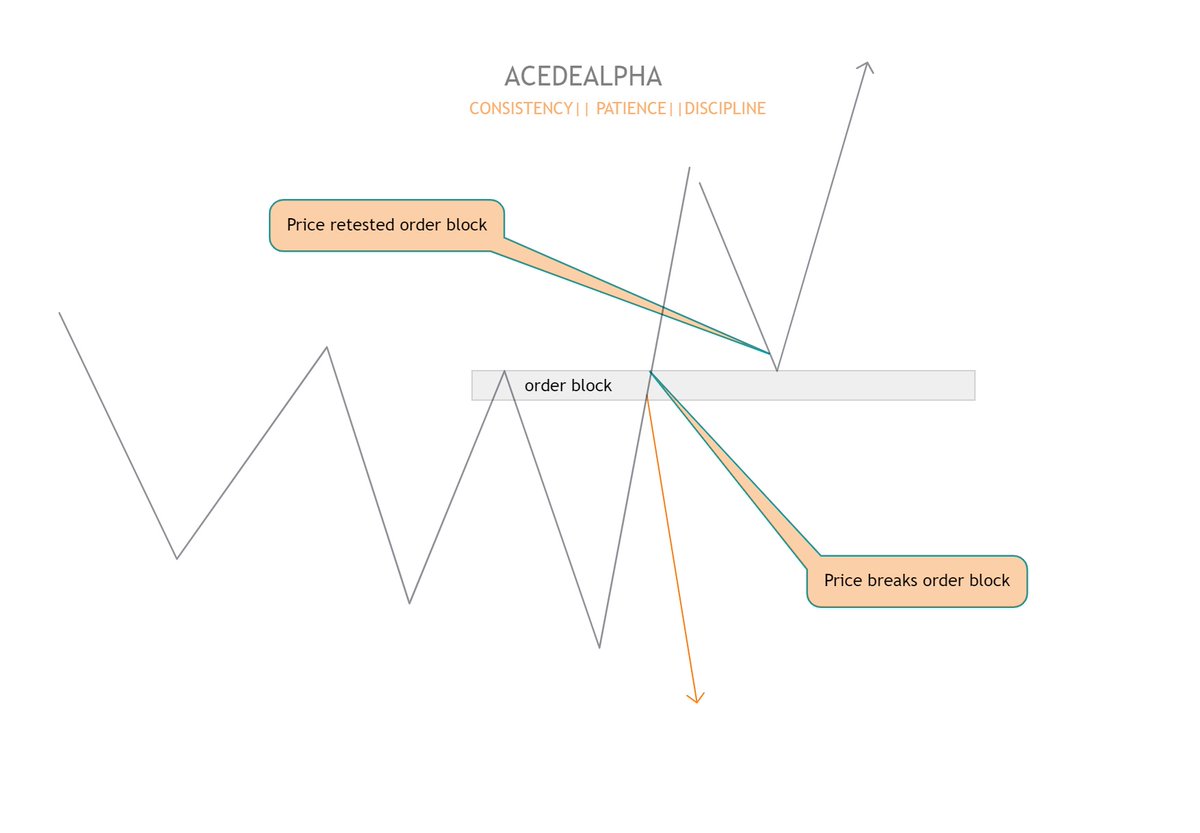
When price returns to this level, it gets filled and price moves in the same direction once more.
There are basically two types of OBs namely:

2. Bearish OB
OBs are usually found at swing lows or swing highs but this does not have to be the case; Order blocks can also form in the middle of a range, just that it may be short term
Without further ado, let's dive into the types of OBs
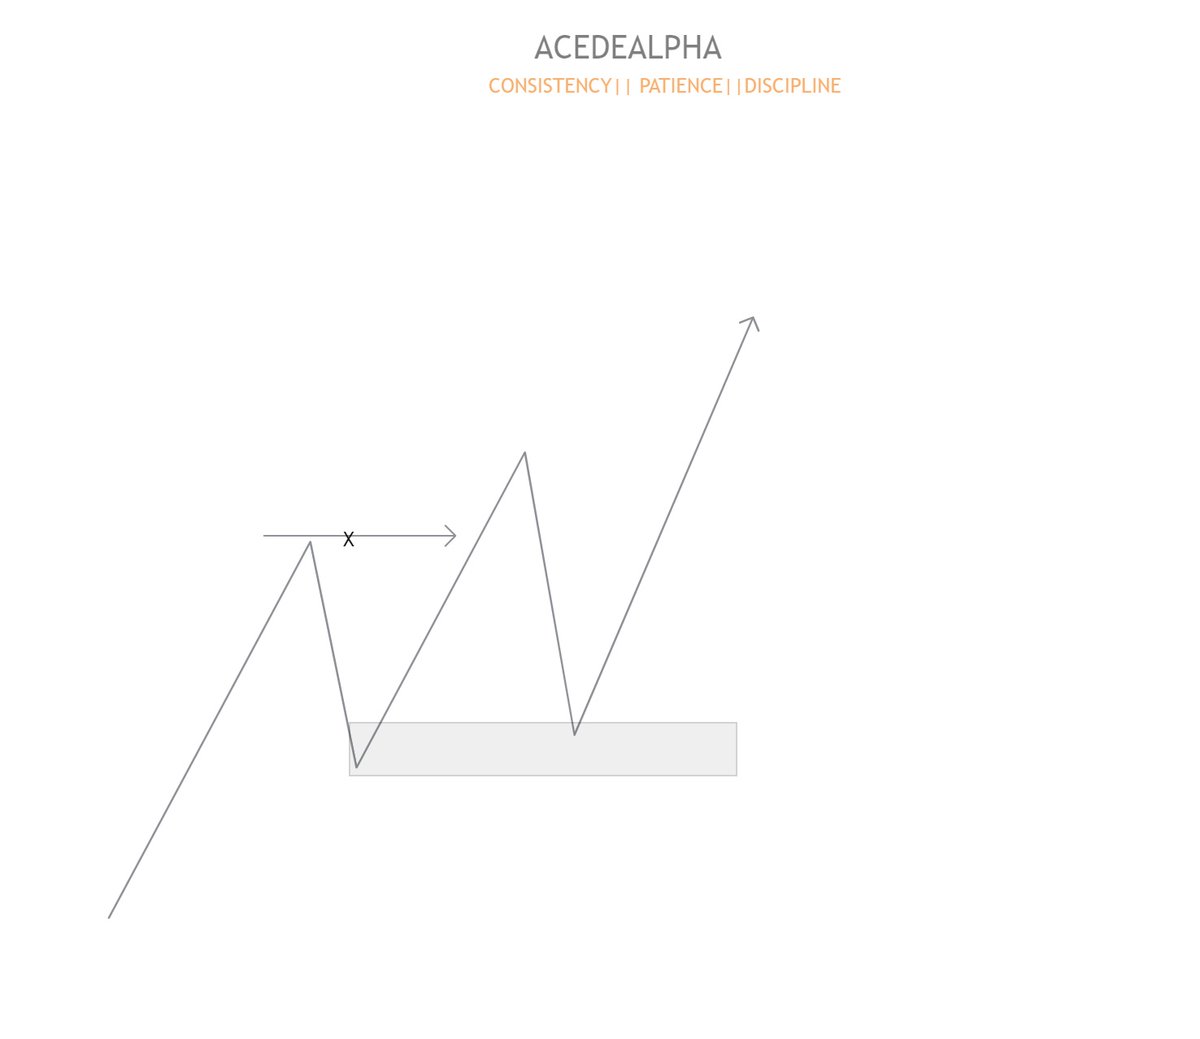
On an uptrend, price tends to move upwards and each time there is a break of structure, there's usually an OB left behind, in such case, when price is coming back to that level once again, orders are picked at the OB left behind
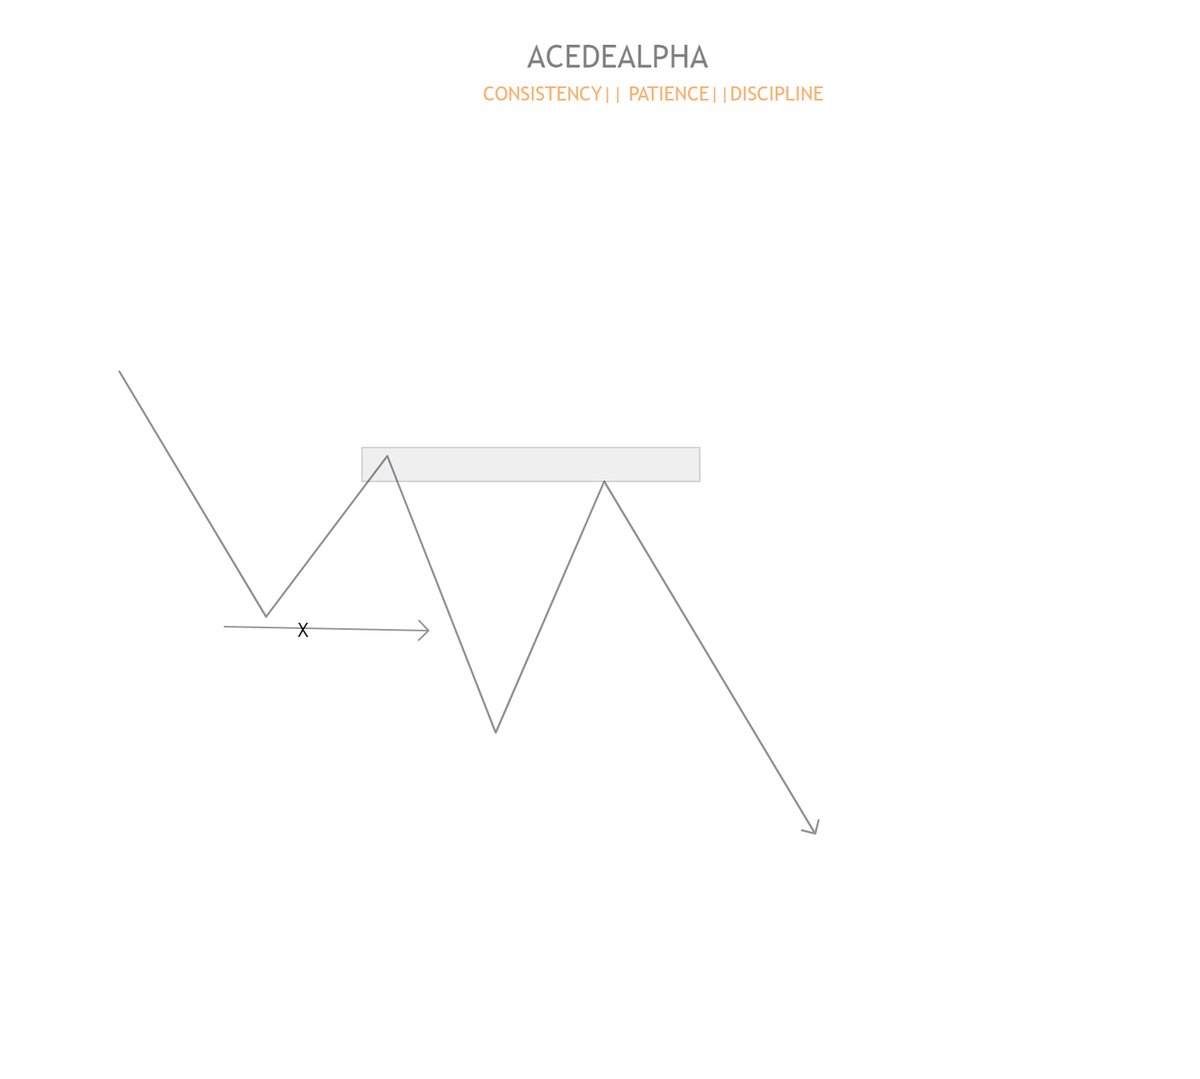
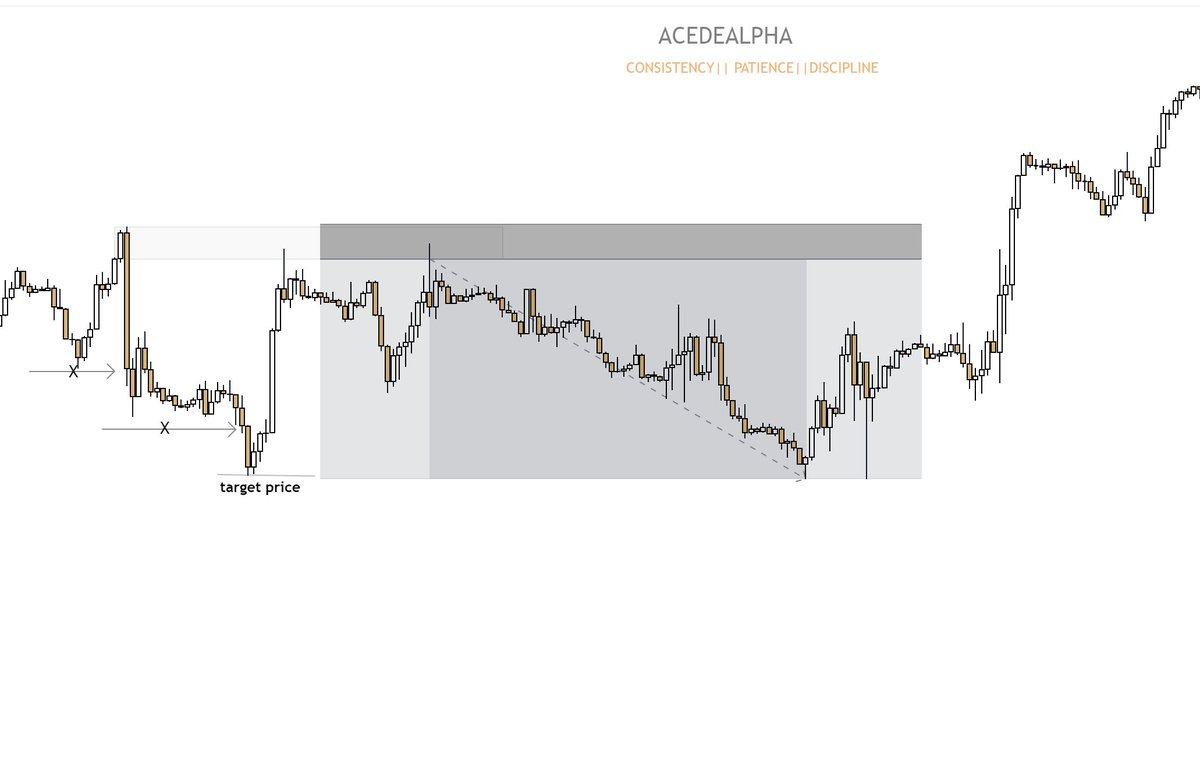
On a downtrend, price tends to move downwards and each time there is a break of structure, there's usually an OB left behind, in such case, when the price is coming back to that level once again, orders are picked at the OB left behind
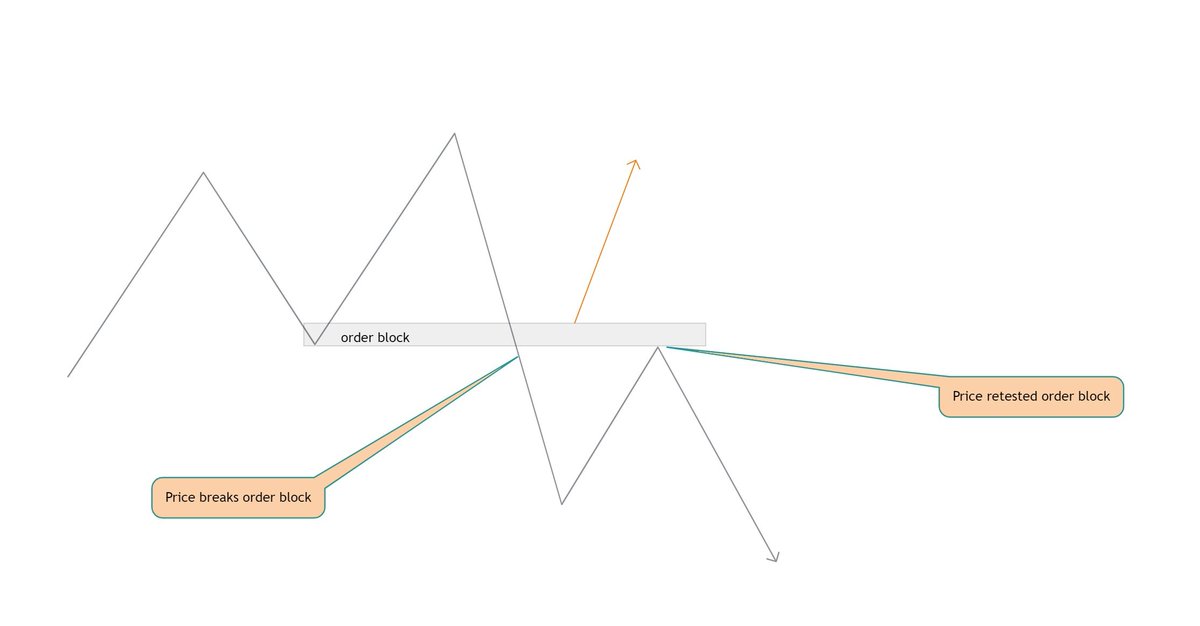
Well.. An order block becomes a breaker block after price passes through it and and holds above it.


I think y'all should be able to recognise a good and valid OB when analysing the market by now

@Marresecira @D3TRIOTT @neehyeehwah @Starr_gael @Tev @_InvestorBen @InvestorBateon @AartTheTrader @Alh_Myke1
More from this author
Following these 16 trading psychology techniques😉 can help you succeed✅️ in the market🪡: 1. Create trade strategy and execute them 2. Maintain emotio...
Effectively managing your finances needs more than just a mastery of financial terms and techniques; it also calls for discipline and the capacity to...
I talked about discipline on a space yesterday and I just thought I should write a thread on👇👇 How to Trade with Discipline ⚠️ Important thread🧵 F...
Recent Threads
I’ve recently seen a lot of people criticizing smaller indie projects for releasing merchandise or doing kickstarter funding to fund their projects. T...

I compiled all the specific references I noticed in May's moveset! #イニブ #g_bd #g_bdr #GBDR https://t.co/PvNHzH6yj6

taekook taguan ng anak au wherein jk received a surprising gift from their xmas party… [ christmas special 🎄] https://t.co/WY3C450KpV

@HitWithAHeart I hear him before I see him. The weight of his steps on the stairs. Slower than usual. Measured. Like he’s already bracing for whatev...

(1/7) I'm not going to do a full trailer breakdown for Zach Cregger's Resident Evil film, since we have an early form of the script you can place a lo...

Nikola Jokic is 0-6 against 50+ win teams in the playoffs. https://t.co/l5hCeVCoUj

Popular Threads
Ware County, Ga has broken the Dominion algorithm: Using sequestered Dominion Equipment, Ware County ran a equal number of Trump votes and Biden vote...

1. There are more people added on the list of arrests and executions of famous people but no further intel is available at this time. ARRESTS and EXE...

These are the 41 most powerful tenants of Tateism for a man to live by. Wether you are Christian, Muslim; It doesn’t matter if you are strong, weak...

ICT’s 2022 Mentorship Summarized: https://t.co/zFJCgIfDAR

Here's 40 TikTok hooks that could make you go viral. (Not in any particular order) //THREAD//

A thread: Pakistani newspaper Dawn's front pages from 4th december 1971 to 20 December to see how they kept their own people in the dark. This was on...
